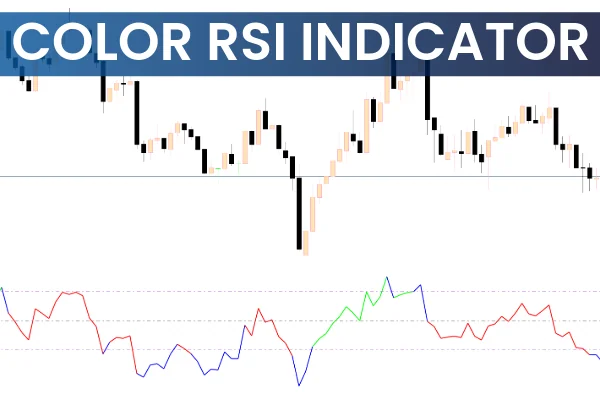
The Color RSI indicator for MT5 is an advanced version of the classic Relative Strength Index (RSI). Designed for both beginners and experienced forex traders, this indicator not only shows overbought and oversold conditions but also provides clear BUY and SELL trading signals directly on your chart. By using color-coded signals, traders can make informed decisions and optimize their trading strategies.
H2: What is the Color RSI Indicator for MT5?
The Color RSI indicator is a modified version of the traditional RSI, with enhancements to improve trading efficiency:
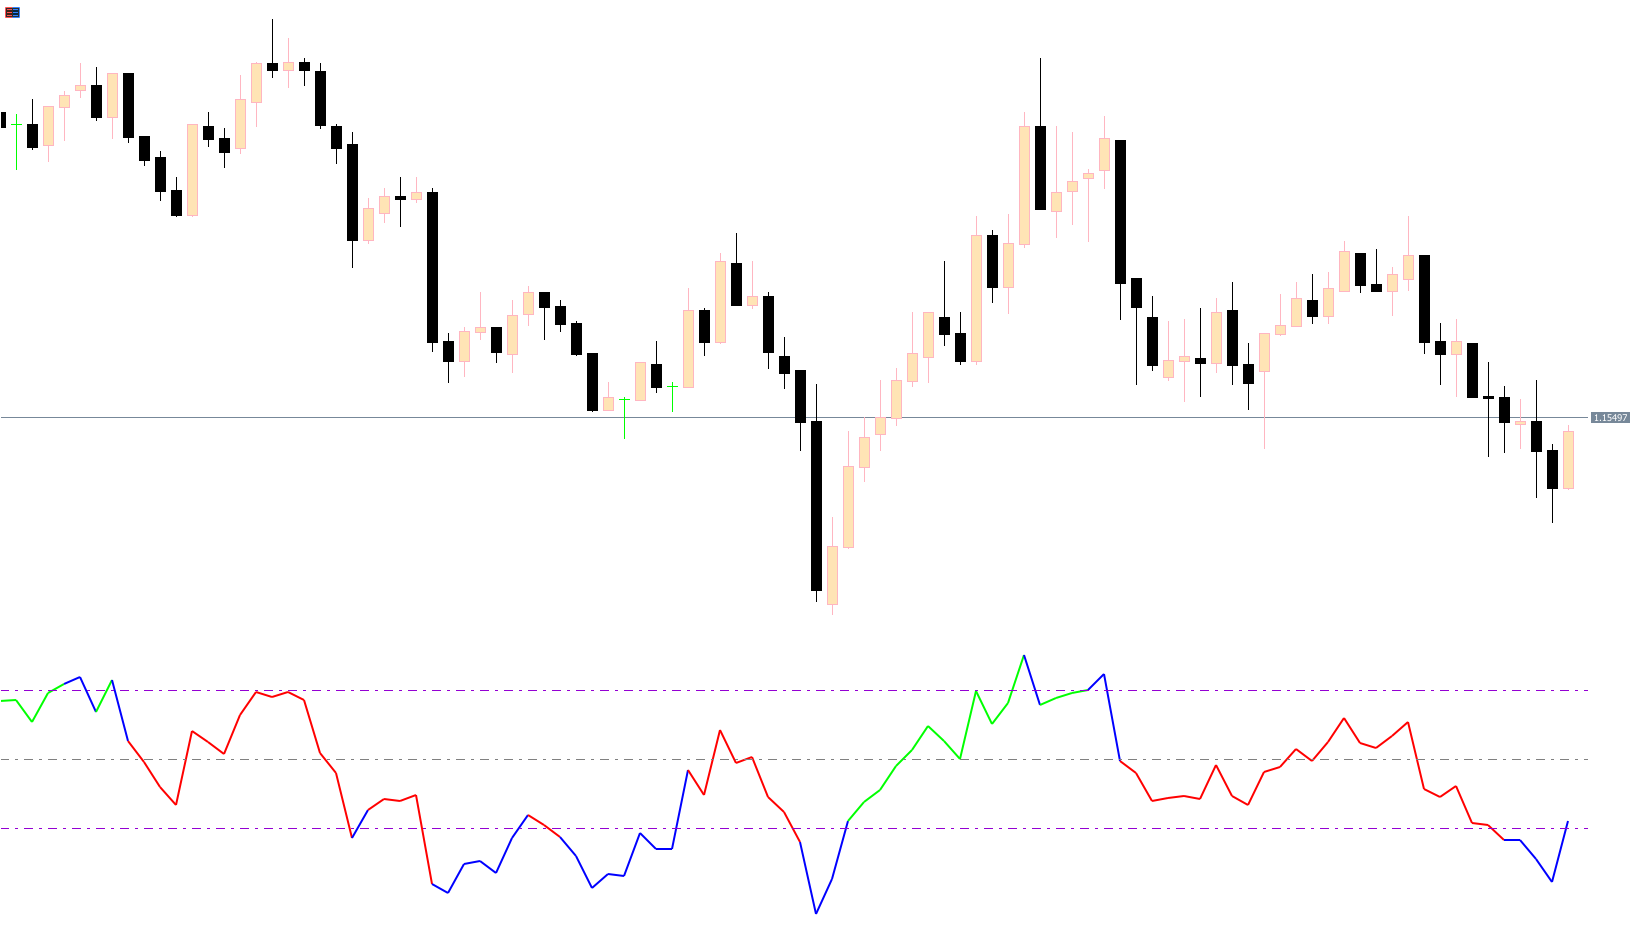
Color-coded oscillator: The indicator changes color based on market conditions – red indicates oversold, green signals overbought, and blue represents neutral zones.
Buy and Sell signals: Automatic alerts help traders identify entry and exit points.
Compatibility: Works on all intraday, daily, weekly, and monthly charts.
This unique combination of visual cues and trading signals makes it easier to identify potential market reversals and trends.
H3: How the Color RSI Indicator Works
The indicator measures momentum and Trend Strength like a standard RSI but adds visual enhancements:
Oversold Conditions: When RSI values fall below 40, the oscillator turns red, signaling a potential bullish reversal. Traders may consider entering a BUY trade with a stop loss below the previous swing low.
Overbought Conditions: If RSI rises above 60, the oscillator turns green, indicating a potential bearish reversal. Traders may enter a SELL trade with a stop loss above the previous swing high.
Trend Confirmation: Using multiple timeframes, traders can analyze the overall trend and determine the best entry points on lower timeframes.
By following these color cues, forex traders can maximize profits while minimizing risk.
H2: Benefits of Using the Color RSI Indicator
Using this indicator offers several advantages:
Enhanced Visual Signals: The color changes simplify trend analysis and market condition recognition.
Free Download and Easy Installation: Traders can quickly install it on MetaTrader 5 without complicated setups.
Adaptable to Any Strategy: Works well with technical strategies, Candlestick Patterns, and trend analysis.
Suitable for All Traders: Both beginners and professionals can benefit from clear trading signals.
H3: Trading Tips for Maximum Efficiency
To get the most out of the Color RSI Indicator for MT5:
Combine it with other technical indicators to confirm trends.
Monitor higher timeframes for market direction and lower timeframes for precise entries.
Use proper risk management and take profits at opposite signals or strong risk/reward ratios above 1:2.
Regularly update MetaTrader 5 for optimal performance.
With these techniques, the Color RSI indicator can become a cornerstone of a profitable forex trading strategy.
H2: Conclusion
The Color RSI Indicator for MT5 upgrades the classic RSI by providing actionable BUY and SELL trading signals and intuitive color-coded alerts. It’s an essential tool for forex traders looking for better market timing and trend analysis. Start improving your trades today by downloading the indicator for free at IndicatorForest.com.
FAQ
11 Downloads
Published:
Dec 02, 2025 03:56 AM
Category: