The Colored Stochastic Indicator for MT4 is a visually enhanced version of the classic stochastic oscillator. It highlights overbought and oversold zones using two distinct colors—red for overbought and lime for oversold.
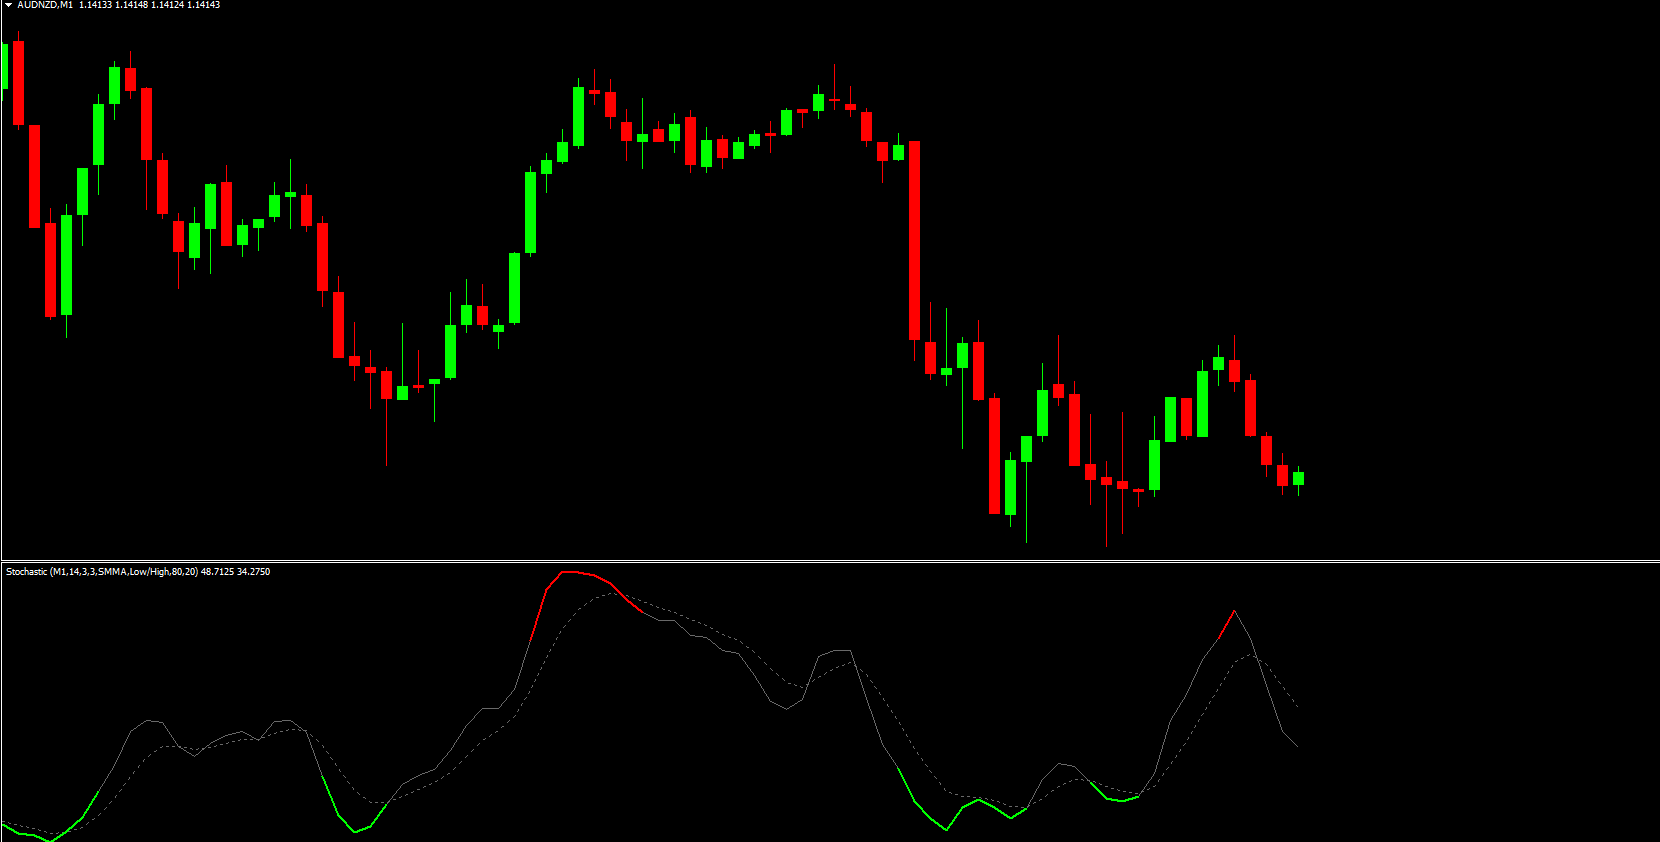
This simple color-coding helps traders quickly recognize potential reversal zones without having to interpret multiple stochastic lines or numerical values. Both beginners and advanced traders appreciate this indicator for its clean, intuitive design.
Why Traders Prefer the Colored Stochastic Indicator
Unlike the standard stochastic, which uses two lines that can sometimes clutter the chart, this version simplifies interpretation:
Red Line = Overbought = Potential SELL Zone
Lime Line = Oversold = Potential BUY Zone
These color changes serve as early warnings of potential market turning points. Even novices can immediately identify when the market may be preparing for a pullback or reversal.
The indicator is suitable for:
Trend traders looking for pullback entries
Reversal traders identifying exhaustion points
Scalpers seeking quick oversold/overbought setups
Swing traders using multi-timeframe analysis
How to Trade Using the Colored Stochastic Indicator
The example above shows the indicator applied to the EUR/USD chart. Here’s how to interpret the signals:
BUY Signal
A lime-colored line appears at the bottom of the indicator window, signaling oversold conditions.
This means buyers may soon step into the market.
For confirmation, combine with:
Bullish candlestick patterns (e.g., bullish engulfing)
Support zone reactions
Trendline bounces
SELL Signal
A red line appears at the top of the indicator window, indicating overbought conditions.
This may signal an upcoming bearish reversal.
Confirm using:
Bearish engulfing patterns
Resistance level tests
Divergence or trend breakouts
Important Tip
While the Colored Stochastic performs well in many market conditions, it is most effective in trending markets when used to identify pullbacks.
For example, in a bullish trend, wait for the line to turn lime, then use candlestick confirmation—such as a bullish engulfing candle—to time your entry with the main trend.
Conclusion
The Colored Stochastic Indicator for MT4 enhances the traditional stochastic oscillator with easy-to-read color cues. Its simple red/lime visualization makes it ideal for spotting overbought and oversold zones at a glance. When paired with price action or other technical tools, it becomes a reliable confirmation indicator for Trend Continuation and reversal trades.
The indicator is free to download and integrates seamlessly into any MT4 trading setup.
FAQ
The Colored Stochastic Indicator MT4 enhances the traditional Stochastic oscillator by using color-coding to make signals easier to interpret. Instead of analyzing lines and levels manually, the color system provides instant visual feedback about overbought/oversold conditions and momentum direction, making it more user-friendly than standard Stochastic.
The indicator typically uses colors to represent different market conditions. Green colors may indicate bullish momentum or oversold conditions recovering, while red colors may show bearish momentum or overbought conditions. The color changes help traders quickly identify when conditions are shifting without analyzing numerical values.
Enter buy trades when the indicator shows bullish colors and Stochastic is recovering from oversold conditions. Enter sell trades when it shows bearish colors and Stochastic is declining from overbought conditions. Always confirm with price action, support/resistance levels, or trend direction to improve accuracy.
Color-coding makes Stochastic analysis faster and easier by providing instant visual feedback. Traders can quickly identify market conditions at a glance without calculating Stochastic values or analyzing line positions. This visual approach is particularly helpful for beginners learning to use Stochastic indicators.
The indicator works on all MT4 timeframes and currency pairs, making it suitable for scalping, intraday trading, and swing trading strategies. The color-coded system makes it easy to use across different timeframes, helping traders quickly identify overbought/oversold conditions and momentum changes.
Published:
Dec 14, 2025 13:09 PM
Category: