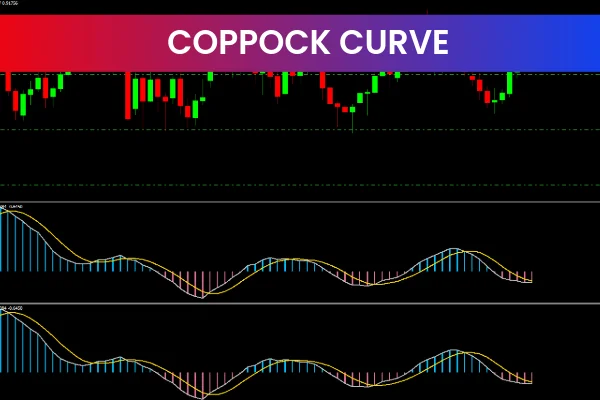
The Coppock Curve Indicator is a popular and free Forex tool used to identify long-term trends in the currency markets. Developed by Edwin Coppock in 1962, this momentum oscillator helps traders anticipate the beginning of long-term bull markets.

By analyzing changes in market momentum over time, the Coppock Curve Indicator allows traders to make informed decisions about trend direction, entry points, and exit points.
How the Coppock Curve Indicator Works
The Coppock Curve Indicator is based on weighted moving averages of the rate of change of a security:
Calculate the 11-period rate of change and the 14-period rate of change of a currency pair
Sum these values and apply a 10-period weighted moving average to smooth the results
Plot the indicator on a chart, typically ranging from 0 to 100
Key interpretation points:
Above zero: Indicates a bullish market trend
Below zero: Indicates a bearish market trend
This smooth and easy-to-read curve helps traders identify potential long-term trends in the Forex market.
Why Traders Use the Coppock Curve Indicator
The Coppock Curve Indicator is widely used because it provides:
Long-term trend analysis: Helps identify the start of major market trends
Momentum insights: Tracks shifts in market momentum to anticipate trend reversals
Easy interpretation: Above or below zero signals provide clear bullish or bearish indicators
Suitability for MT4: Compatible with multiple timeframes and currency pairs
Its combination of simplicity and effectiveness makes it a valuable tool for both novice and experienced traders looking to trade long-term trends.
Trading Strategies Using the Coppock Curve Indicator
Bull Market Entry Strategy
Traders often use the Coppock Curve Indicator to spot the beginning of long-term bullish trends. A move from below zero to above zero is considered a potential signal to enter long positions in the market.
Bear Market Exit Strategy
The indicator can also help identify the end of bullish trends. When the Coppock Curve turns downward after reaching positive levels, traders may consider closing long positions or preparing for potential short trades.
Trend Confirmation Strategy
Many traders combine the Coppock Curve with other indicators, such as moving averages or Support And Resistance levels, to confirm market direction before entering trades. This approach reduces false signals and improves overall trading accuracy.
Best Timeframes for the Coppock Curve Indicator
The Coppock Curve Indicator is best suited for long-term analysis, making it ideal for:
Daily charts: Identify major market trends
Weekly charts: Confirm overall market direction for swing trades
Long-term trading strategies: Useful for position trading and trend-following
Using higher timeframes improves signal reliability and minimizes market noise.
Combining the Coppock Curve Indicator with Other Tools
For enhanced trading accuracy, the Coppock Curve Indicator can be combined with:
Support and resistance levels for optimal entry and exit points
Moving averages to confirm long-term trends
Other momentum indicators like RSI or MACD for additional validation
You can find more MT4 indicators and Forex trading tools on IndicatorForest.com to build complete trading strategies.
Final Thoughts on the Coppock Curve Indicator
The Coppock Curve Indicator is a powerful and reliable MT4 tool for identifying long-term market trends. Its momentum-based approach provides clear bullish or bearish signals, helping traders time entries and exits effectively.
Whether you are a swing trader, position trader, or long-term Forex investor, the Coppock Curve Indicator is an essential addition to your MT4 toolkit.
👉 Visit IndicatorForest.com to explore more free MT4 indicators, professional trading tools, and Forex strategy resources.
Published:
Dec 27, 2025 13:34 PM
Category: