Anchor Your Intraday Trading to Higher-Timeframe Realities with the Daily Channel Indicator
One of the most frequent mistakes retail day traders make is ignoring the broader market context. When you are zoomed deep into lower timeframes like the 5-minute or 15-minute charts, it is incredibly easy to mistake a minor retracement for a brand-new trend. Without structural context from higher timeframes, retail traders frequently buy right into major daily resistance levels or sell directly into major daily support floors. The Daily Channel indicator bridges this analytical gap by plotting institutional-grade daily market structures directly onto your lower-timeframe workspace.
What is the Daily Channel Indicator?
The Daily Channel indicator is an automated structural charting software designed for MetaTrader platforms. Instead of forcing you to constantly flip back and forth between short-term execution charts and the daily (D1) macro layout, this tool mathematically maps the previous day's trading parameters directly onto your active screen.
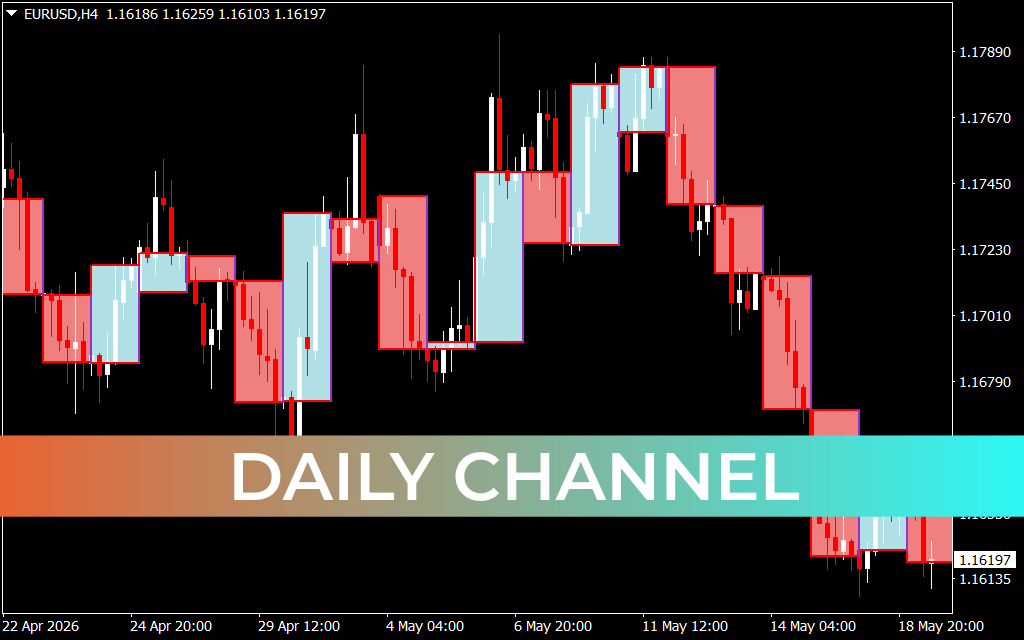
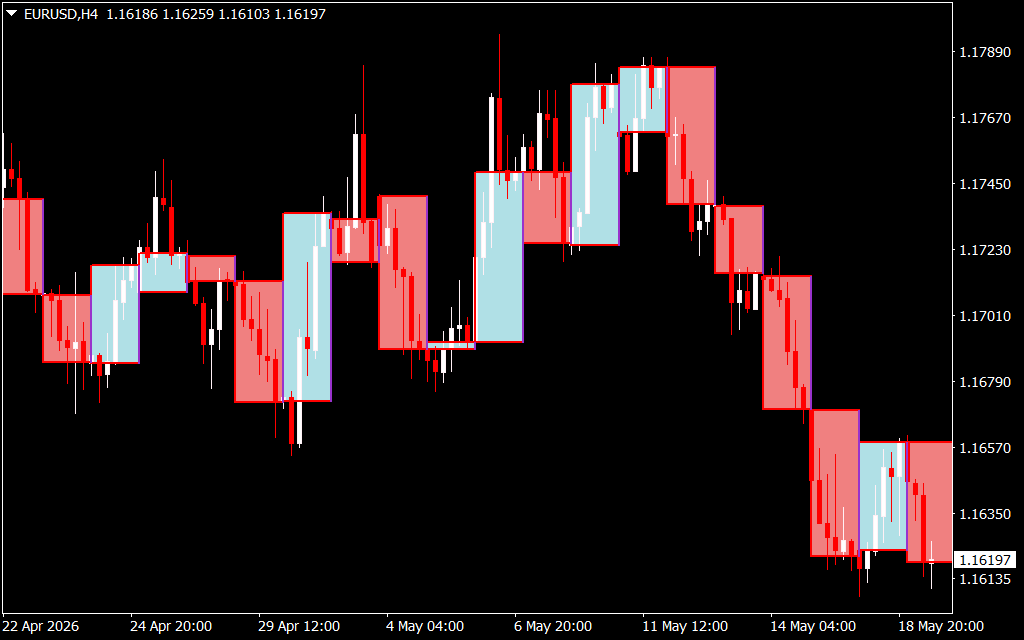
The indicator identifies the true structural extremes of the previous daily session: the absolute daily high, the absolute daily low, and the closing value. It then projects these key horizontal levels forward as a continuous, geometric channel overlay. By visualizing the previous day's trading range as structural blocks or bands, you instantly see where current intraday Price Action stands relative to macro institutional value.
Key Structural Features and Technical Advantages
- Multi-Timeframe Confluence: It allows swing traders, day traders, and scalpers to view macro daily boundaries on lower-tier charts, ensuring all trades are executed with higher-timeframe alignment.
- Dynamic Range Shading: As shown on major assets like the EUR/USD H4 chart, the indicator utilizes clean, color-coded blocks (such as light blue for bullish expansions and light red for bearish extensions) to highlight structural ranges cleanly.
- Objective Support And Resistance: It replaces subjective manual trendlines with fixed, mathematically verified daily levels that institutional order blocks frequently react to.
- Clutter-Free Visual Layout: The software overlays directly on top of your standard Japanese candlesticks, leaving your sub-windows entirely open for momentum tracking or volume indicators.
How to Trade with the Daily Channel Indicator
Trading with the Daily Channel indicator centers on exploiting intraday breakouts or capturing mean-reversion rejections at the daily channel boundaries.
- Trading the Channel Rejection (Mean Reversion): Watch for an intraday asset rally to hit the upper ceiling of the daily channel block. If price action stalls and prints a bearish reversal pattern at this line, it proves that the daily high is being defended by sellers. Execute a short position to target the channel midpoint.
- Trading the Channel Breakout (Trend Expansion): If an asset experiences an influx of volume and breaks completely out of the daily channel structure, an explosive expansion is underway. Wait for a candle to close decisively outside the shaded zone, then execute a breakout trade in the direction of the momentum.
Synchronize your strategy with institutional market flows by downloading the Daily Channel indicator today.
3 Downloads
Last Update:
May 19, 2026 16:48 PM
Published:
Jan 19, 2026 17:58 PM
Category: