Daily H-L Indicator

Daily H-L Indicator
Free

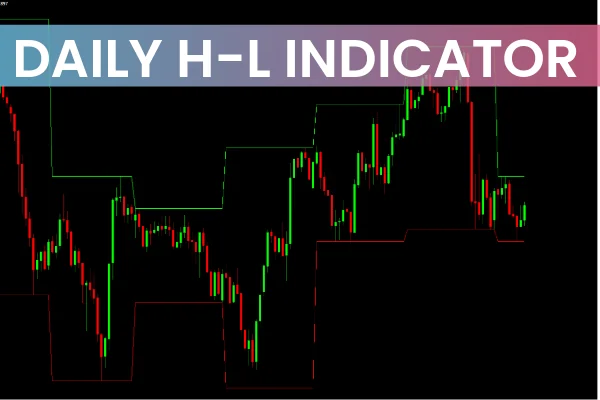
The Daily H-L Indicator for MT4 is a powerful tool designed to calculate the high and low prices of any timeframe and display them directly on the current chart. Traders using strategies based on daily highs and lows can benefit greatly from this indicator. Additionally, it serves as a trend indicator, allowing you to interpret bullish and bearish market conditions.

This indicator is suitable for both beginner and experienced forex traders. It works across all intraday charts as well as daily, weekly, and monthly timeframes. For best results, traders should combine it with other technical indicators or Price Action patterns to confirm reversal signals and improve trade accuracy.

How the Daily H-L Indicator Works

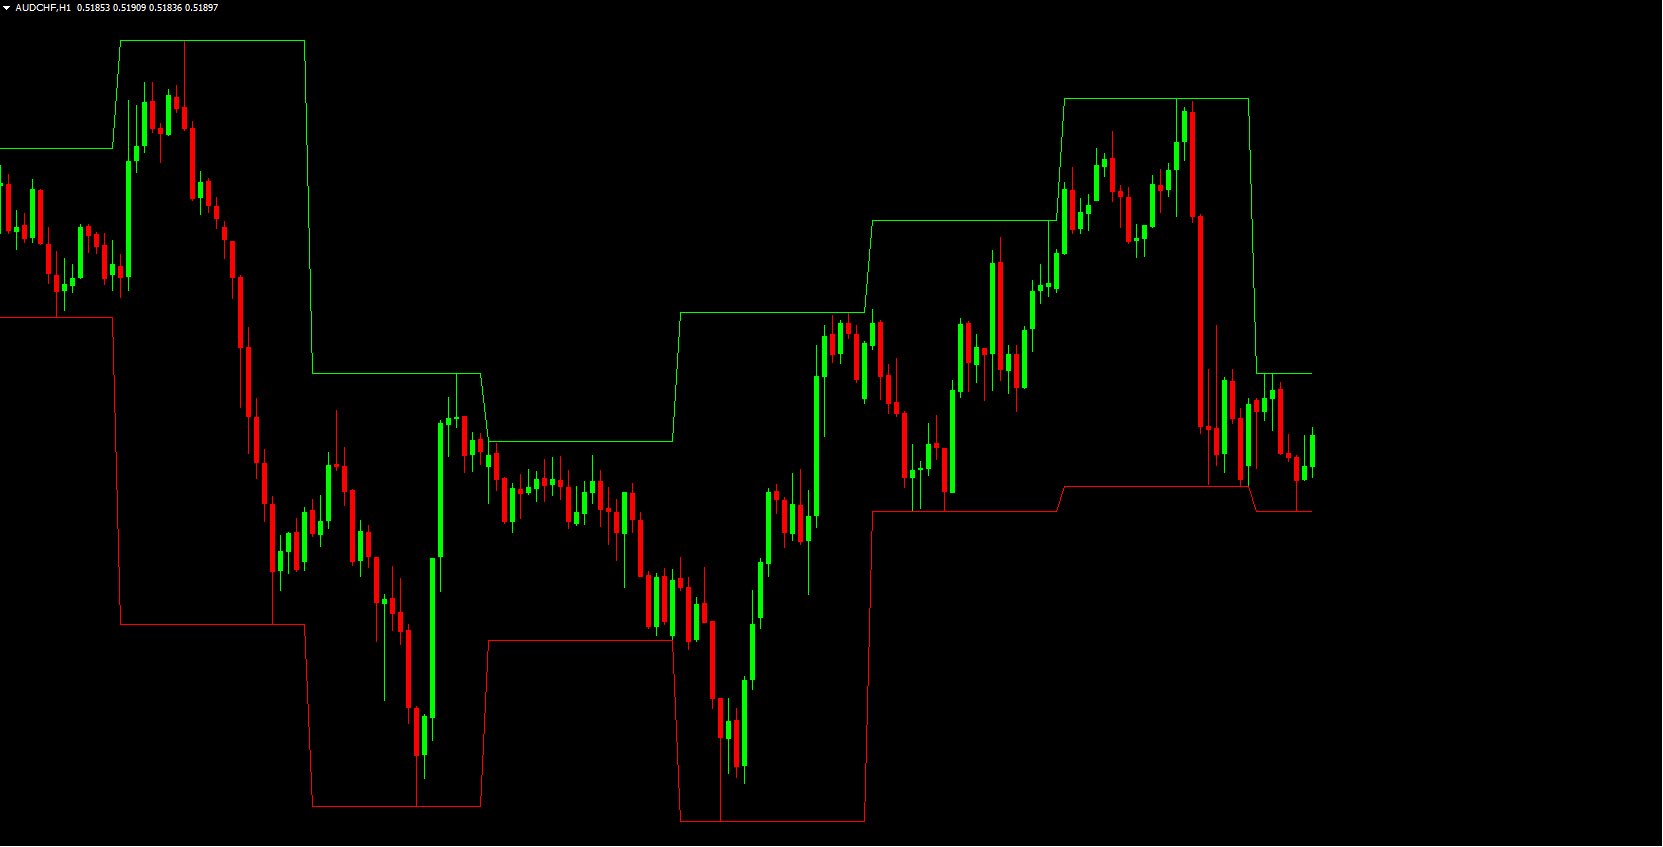
The indicator continuously plots the high in LIME and the low in RED, providing clear visual signals for key trading levels.

Buy Signals

When price reaches the daily low, it can act as support, providing an entry point for a BUY trade.

Place the stop loss below the previous swing low to avoid whipsaws.

The take profit level is ideally set near the daily high.

Sell Signals

When price bounces from the daily high, it can act as resistance, providing a SELL opportunity.

Place the stop loss above the previous swing high.

Exit near the daily low for optimal profits.

Trend Analysis

Continuous breaks of daily lows indicate a strong bearish trend.

Continuous breaks of daily highs suggest a strong bullish trend.

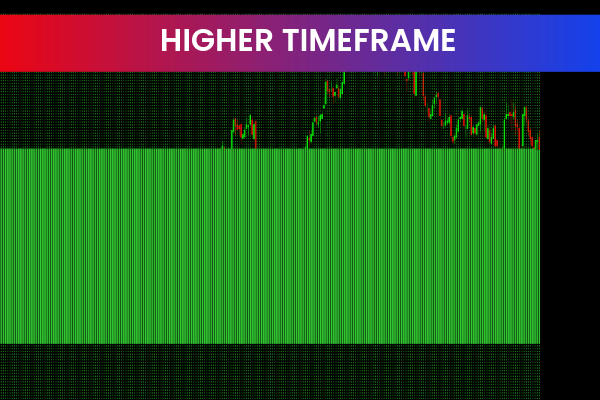
Multi-Time Frame Trading

The Daily H-L indicator is also effective for multi-time frame (MTF) trading. Trends identified on higher timeframes often persist longer, allowing traders to align lower timeframe trades with the overall market direction.

Benefits of the Daily H-L Indicator

Highlights high and low price levels for precise entries and exits

Serves as a trend indicator for bullish and bearish markets

Useful for BUY at low and SELL at high strategies

Supports multi-time frame trading for better trend alignment

Can be integrated with automated trading systems

Free to download and easy to install on MT4

Call to Action

Maximize your forex trading strategy with the Daily H-L Indicator for MT4. Download it for free from IndicatorForest.com and start trading highs and lows with confidence.

FAQ

It displays lime lines for daily highs and red lines for daily lows, acting as key support/resistance levels.

It displays lime lines for daily highs and red lines for daily lows, creating key support/resistance levels.

It displays lime lines for daily highs and red lines for daily lows, creating key support/resistance levels.

It displays lime lines for daily highs and red lines for daily lows, creating key support/resistance levels.

Enter buys when price reaches daily low (red line), acting as support, with stops below and targets at daily high.

Price reaching red daily low line acts as support for buy entries, with stops below and targets at lime daily high.

Price reaching red daily low line acts as support for buy entries, with stops below and targets at lime daily high.

Price reaching red daily low line acts as support for buy entries, with stops below and targets at lime daily high.

Price hitting lime daily high line acts as resistance for sell entries, with stops above and targets at red daily low.

Price hitting lime daily high line acts as resistance for sell entries, with stops above and targets at red daily low.

Enter sells when price hits daily high (lime line), acting as resistance, with stops above and targets at daily low.

Price hitting lime daily high line acts as resistance for sell entries, with stops above and targets at red daily low.

They represent major turning points where institutional traders position, making reactions more predictable.

They represent major turning points where institutional traders position, making reactions more predictable.

They represent major turning points where institutional traders position, making them reliable for intraday trading.

They represent major turning points where institutional traders position, making reactions more predictable.

Check daily levels on higher timeframes first, then trade bounces on lower timeframes for better accuracy.

Check daily levels on higher timeframes first, then trade bounces on lower timeframes for better accuracy.

Check daily levels on higher timeframes first, then trade bounces on lower timeframes for better accuracy.

Check daily levels on higher timeframes first, then trade bounces on lower timeframes for better accuracy.

Published:

Nov 21, 2025 02:01 AM

We use cookies to personalize your experience. By continuing to visit this website you agree to our use of cookies

GDPR and cookie policy