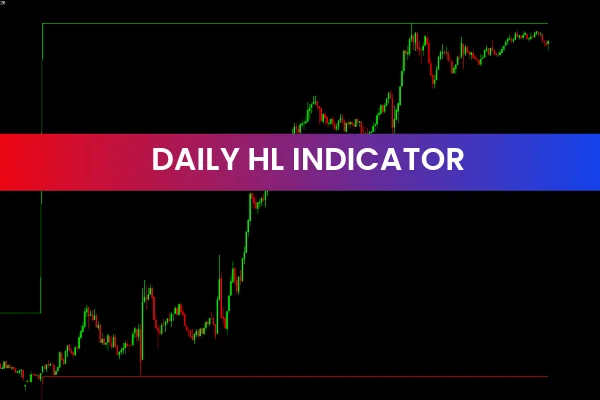
The Daily H-L Indicator is a popular and free Forex Indicator for the MetaTrader 4 (MT4) platform. It is designed to help traders quickly identify potential trading opportunities by displaying the previous day’s high and low price levels on the current trading day.
High and low levels from the prior day are widely used in technical analysis because they often act as key support and resistance zones. By automatically plotting these levels, the Daily H-L Indicator allows traders to understand market context at a glance and make more informed trading decisions without manual calculations.
What Is the Daily H-L Indicator?
The Daily H-L Indicator is a price-level reference tool that marks the highest and lowest prices from the previous trading day directly onto today’s chart. These levels provide valuable insight into recent market behavior and help traders anticipate how price may react.
Whether the market is consolidating, trending, or preparing for a breakout, the previous day’s range often plays a critical role in guiding Price Action.
How the Daily H-L Indicator Works
Once attached to a chart, the indicator automatically calculates and plots:
Previous Day High Level
Previous Day Low Level
These levels remain visible throughout the current trading session, giving traders a constant reference point. The indicator works on all timeframes, allowing flexibility for different trading styles.
Key Features of the Daily H-L Indicator
Automatic High and Low Plotting
The indicator instantly plots the previous day’s high and low without manual effort.
Clean and Clear Chart Display
Horizontal lines are drawn clearly, keeping charts uncluttered and easy to read.
Works on Any Timeframe
Traders can use the Daily H-L Indicator on intraday or higher timeframes.
Free and MT4 Compatible
The indicator is free to use and fully compatible with the MT4 trading platform.
Benefits of Using the Daily H-L Indicator
Identify Market Range
The distance between the previous day’s high and low shows whether the market was volatile or consolidating.
Spot Breakout Opportunities
When price breaks above the previous high or below the previous low, it may signal the start of a new move.
Improve Entry and Exit Planning
Previous high and low levels often act as natural entry triggers, stop-loss zones, or profit targets.
Simple and Beginner-Friendly
The indicator is easy to install, understand, and integrate into any trading strategy.
Using the Daily H-L Indicator in a Consolidating Market
When the previous day’s high and low levels are close together, it often indicates consolidation. Traders may anticipate a breakout and prepare for trades when price moves beyond either level with strong momentum.
This approach is especially popular among breakout and Scalping traders.
Using the Daily H-L Indicator in a Trending Market
When the previous day’s range is wide, it may suggest strong trending conditions. Traders often look for pullbacks toward the high or low levels as potential continuation setups.
The previous day’s high or low can also act as dynamic support or resistance during trends.
Best Practices for Trading with the Daily H-L Indicator
Combine with Price Action
Candlestick patterns near the high or low levels provide strong confirmation signals.
Use with Trend Indicators
Combining the Daily H-L Indicator with moving averages or trend indicators improves accuracy.
Apply Risk Management
Always place stop-loss orders beyond key levels to protect against false breakouts.
Why Use the Daily H-L Indicator from IndicatorForest.com?
At IndicatorForest.com, traders can access reliable and professionally curated MT4 indicators that simplify technical analysis. The Daily H-L Indicator is an essential tool for traders who want a quick and effective way to analyze daily price ranges and plan trades with confidence.
Call to Action:
Visit IndicatorForest.com today to download the Daily H-L Indicator and explore more powerful forex indicators to enhance your trading strategy.
FAQ
Published:
Dec 21, 2025 12:54 PM
Category: