The DayTrading Indicator for MT4 is a straightforward, arrow-based trading tool designed to highlight Bullish and Bearish market conditions using visually clear signals. The indicator generates BUY and SELL arrows on the chart and enhances them with a High-Low filter, ensuring that traders only receive more accurate and meaningful entries. Whether you are a new trader seeking simple direction or an experienced forex trader building confluence systems, the ZP DayTrading indicator fits seamlessly into any trading style.
This tool functions effectively on all intraday timeframes such as M5, M15, M30, and H1, as well as higher timeframes including daily, weekly, and monthly charts. Because it adapts well to multiple market conditions and time horizons, traders can integrate it into trend trading, day trading, or swing trading strategies.
How the DayTrading Indicator Works
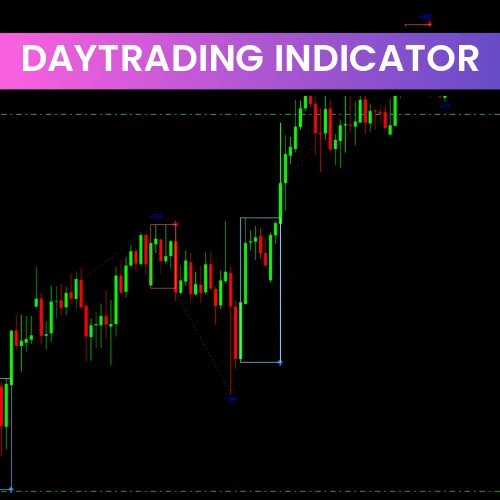
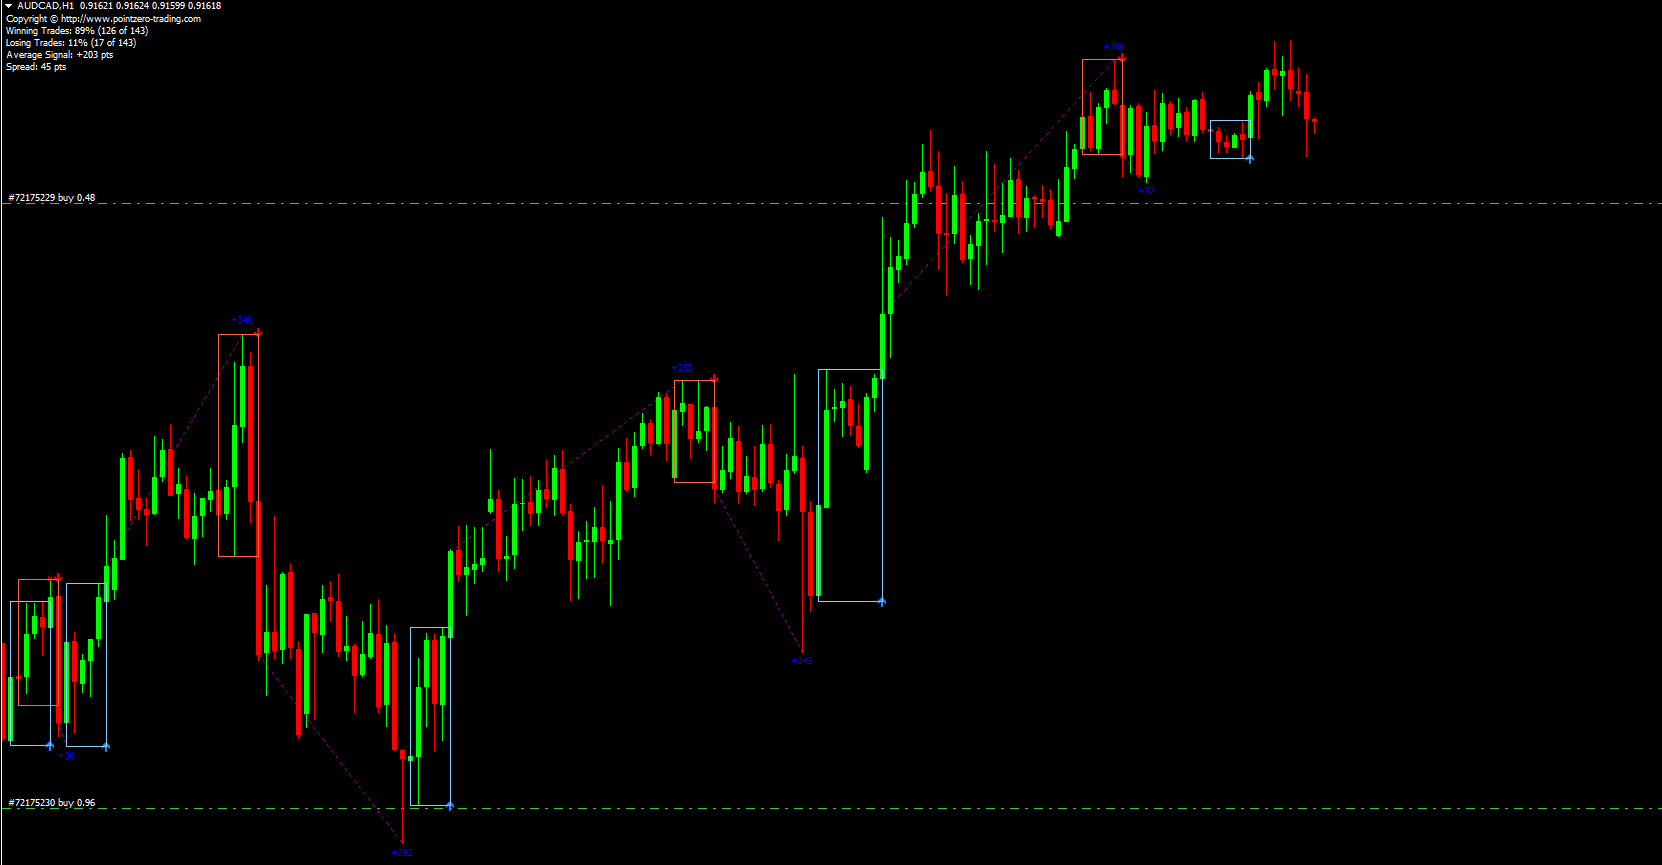
The indicator plots colored rectangles and arrow signals directly on the chart:
BLUE rectangle + BLUE arrow → Bullish trend signal
RED rectangle + RED arrow → Bearish trend signal
These visual cues allow traders to read market direction instantly and execute trades without confusion.
Additionally, the indicator displays trade statistics such as winning trades, losing trades, and average profit in white text, offering real-time performance feedback.
Interpreting BUY and SELL Signals
Bullish Setup (BUY Signal)
When the indicator draws a BLUE rectangle followed by a BLUE arrow, it signals a Bullish trend formation.
How to trade it:
Enter a BUY at or near the arrow.
Place your stop loss below the BLUE rectangle.
Exit the trade at the next opposite SELL signal or at a chosen risk-reward target.
This approach works well on trending pairs like GBPJPY, EURUSD, and XAUUSD.
Bearish Setup (SELL Signal)
A RED rectangle combined with a RED arrow confirms a Bearish trend.
Trading steps:
Enter a SELL after the arrow appears.
Place a stop loss above the RED rectangle.
Exit when the next BUY signal appears or at a pre-defined profit objective.
Because the tool uses a High-Low filter, the signals are typically cleaner and less noisy than those of standard arrow indicators.
Using the Indicator with Top-Down Analysis
The ZP DayTrading Indicator works even better when paired with Top-Down Technical Analysis:
Identify the main trend on H4, Daily, or Weekly charts.
Higher timeframes establish the dominant direction.
Move to M15 or H1 for precise entries.
The indicator will highlight optimal BUY or SELL points in the direction of the major trend.
Use Support And Resistance for added confluence.
Signals near key zones often carry higher probability.
This combination helps traders avoid trading against strong market momentum and reduces false entries.
When to Use Caution
While the ZP DayTrading Indicator is efficient and beginner-friendly, traders should be careful with:
Signals appearing near strong support or resistance
Signals formed during low-liquidity sessions
Arrows triggered during high-impact economic news
Combining the indicator with tools like moving averages, trendlines, or volatility bands can significantly improve trade accuracy.
Conclusion
The DayTrading Indicator for MT4 is a reliable tool that simplifies trading through clear arrow-based BUY and SELL signals complemented by trend rectangles. It suits traders of all skill levels and performs well on both intraday and higher timeframe charts. When used alongside proper technical analysis—especially trendlines, channels, or support/resistance—the indicator can significantly improve day trading consistency.
For the best possible results and more powerful technical tools, visit IndicatorForest.com to download top-rated MT4/MT5 indicators today.
FAQ
The DayTrading Indicator is specifically designed for intraday trading strategies, identifying short-term trading opportunities during the trading day. It helps traders spot potential entry and exit points for day trading by analyzing intraday price movements and market patterns, making it ideal for traders who focus on capturing short-term price movements.
The indicator provides signals that help traders enter and exit positions during the trading day, focusing on short-term price movements rather than longer-term trends. Enter trades when signals appear in alignment with intraday trends, and exit before the trading day ends to avoid overnight risk.
This indicator is optimized for shorter timeframes typically used in day trading, such as M5, M15, M30, and H1 charts. These timeframes allow traders to capture intraday movements and react quickly to changing market conditions during the trading session.
Day trading requires strict risk management including tight stop-loss orders, proper position sizing, and quick exit strategies. Always set stop-losses based on recent price action and avoid holding losing positions overnight, as day trading focuses on capturing short-term movements within the trading day.
The indicator is specifically designed for intraday trading, providing signals that help traders identify short-term opportunities during the trading day. Its focus on intraday patterns and quick signals makes it ideal for day traders who need to make fast decisions and exit positions before market close.
2 Downloads
Published:
Dec 14, 2025 14:47 PM
Category: