The Derivative Oscillator is an advanced technical indicator that combines enhanced versions of the Relative Strength Index (RSI) and the Moving Average Convergence Divergence (MACD). This dual approach allows traders to analyze any instrument across multiple timeframes while providing clear and accurate market signals. The Derivative Oscillator works effectively alongside other technical tools, such as Price Action, trend lines, and chart patterns, offering a versatile addition to any trader’s toolkit.

The indicator provides a detailed view of both market direction and Trend Strength, allowing traders to make better-informed decisions when entering or exiting trades.
How the Derivative Oscillator Is Calculated
The Derivative Oscillator is derived by:
Calculating the difference between a double-smoothed RSI and a simple moving average of a double-smoothed moving average.
Computing the MACD as the difference between the 26-period EMA and 12-period EMA.
These enhancements reduce market noise and generate more accurate buy and sell signals. By combining these two methods, the indicator essentially functions as a two-in-one tool, helping traders identify both trend direction and momentum with greater clarity.
How to Use the Derivative Oscillator
Interpreting Buy and Sell Signals
The Derivative Oscillator behaves similarly to the MACD:
Crossover above zero → Buy signal
Crossover below zero → Sell signal
Positive readings indicate bullish momentum, while negative readings indicate bearish momentum. Traders can confidently follow these signals to enter positions in line with market direction.
Using Slope and Bar Length
The slope of the indicator helps determine trend direction:
Up-sloping bars (negative to positive) → Bullish signal
Down-sloping bars (positive to negative) → Bearish signal
The length of the bars reflects trend strength:
Longer bullish bars → Strong upward momentum
Longer bearish bars → Strong downward momentum
Short bars near the zero line suggest weak trends or consolidation, signaling traders to stay out of trades.
Detecting Divergence
Divergence occurs when the price and indicator move in opposite directions, signaling a potential Trend Reversal:
Price rising while oscillator falls → Bearish divergence
Price falling while oscillator rises → Bullish divergence
This tool is useful for spotting turning points before they appear in price action alone.
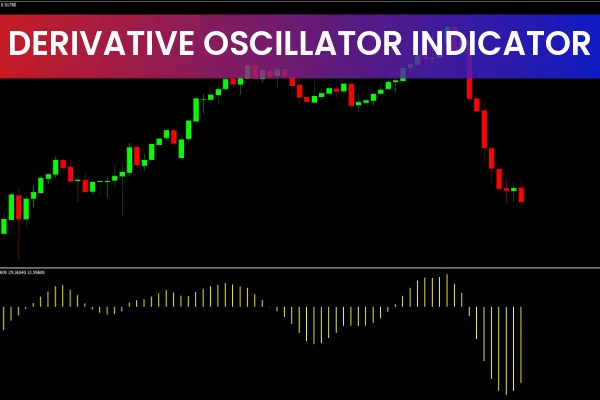
Real Market Trading Example
Consider the Euro versus Japanese Yen (EUR/JPY). During consolidation, the Derivative Oscillator shows short bars near the zero line, signaling weak momentum—traders should avoid entering trades during this phase.
When sellers dominate, bars slope downwards below zero, indicating a strong downtrend. Conversely, uptrend bars above zero indicate bullish momentum. Monitoring both slope and bar length helps assess trend strength.
For example, when upward momentum starts to fade, the bars shorten while approaching zero. Traders can anticipate a trend reversal and prepare to enter a short position as soon as the indicator crosses below the zero line.
Advantages of Using the Derivative Oscillator
Combines RSI and MACD for dual insights
Generates precise buy and sell signals
Measures trend strength with bar length
Detects potential reversals via divergence
Works across multiple instruments and timeframes
By incorporating this indicator into your trading strategy, you can make informed decisions and improve trade timing.
Conclusion
The Derivative Oscillator is a reliable technical tool for identifying market direction and measuring trend strength. Buy opportunities occur when bars move above zero, while downward-sloping bars below zero signal sell opportunities. Its integration of RSI and MACD provides a comprehensive, accurate, and user-friendly approach to trading.
To access high-quality indicators and improve your trading strategy, visit IndicatorForest.com today.
FAQ
1 Download
Published:
Dec 06, 2025 02:47 AM
Category: