Decode Institutional Flow with the Difference Between OOP Indicator
In technical analysis, volume and order flow are the ultimate truths behind price movement. While standard price charts show you where the market went, volume-based indicators reveal how much force was behind the move. Among the specialized tools built for this purpose, the Difference Between OOP indicator stands out as a unique volume-proxy and delta tool engineered to help MetaTrader 4 (MT4) traders spot institutional activity before it triggers massive price breakouts.
Here is a comprehensive look at how this advanced indicator works and how you can use it to build a highly profitable trading edge.
What is the Difference Between OOP Indicator?
The acronym "OOP" in trading technicalities often refers to optimized order placement metrics or structural opening/closing position differences. The Difference Between OOP indicator calculates the underlying divergence between localized buying and selling pressure. Instead of just displaying standard, flat volume bars, it isolates the net difference over a specific period, presenting the data as a clean histogram in a separate sub-window.
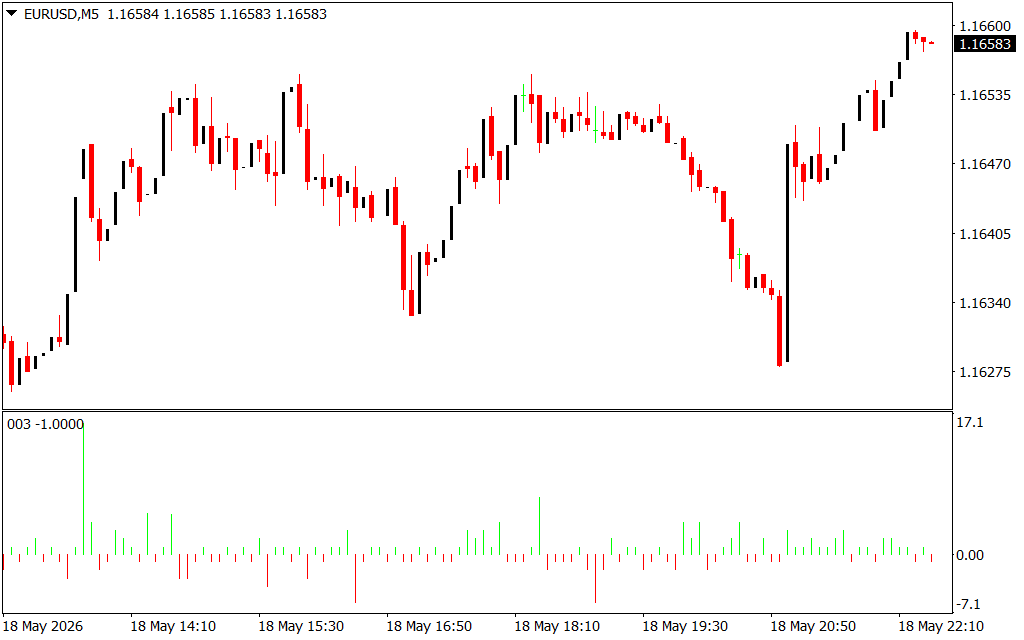
As seen on the EURUSD M5 chart, the indicator plots green vertical bars above the 0.00 baseline to represent a net positive, bullish delta (heavy institutional accumulation). Conversely, red vertical bars below the baseline signal a net negative, bearish delta (institutional distribution). The height of each bar indicates the sheer velocity and magnitude of the order difference.
Major Advantages for MT4 Traders
- Unmask Market Manipulation: Big banks and institutions try to hide their large orders. This indicator tracks the net order footprint, making it easy to see when smart money is quietly loading up on positions.
- Accurate Breakout Confirmation: False breakouts ruin many retail accounts. If price breaks above a key resistance level and the Difference Between OOP indicator spikes with tall green bars, it confirms the breakout has genuine institutional backing.
- Clear Visual Histograms: The simple green and red bar structure removes all guesswork. You can read the current market bias in a single glance without cluttering your main candlestick chart.
Strategic Trading Applications
To extract maximum value from this indicator on MT4, integrate it into your regular workflow using these two methods:
- Divergence Spotting: If Price Action falls and prints a new lower low, but the Difference Between OOP histogram prints a higher low (smaller red bars or shifting to green), the selling pressure is exhausted. This hidden divergence signals an explosive upside reversal is about to happen.
- The Institutional Exhaustion Play: When price approaches a major support level and the red histogram bars begin rapidly shrinking toward the 0.00 line, it shows sellers are running out of steam. This gives you a high-probability opportunity to enter a long position right at the absolute market bottom.
2 Downloads
Last Update:
May 19, 2026 01:31 AM
Published:
Jan 19, 2026 20:57 PM
Category: