The DMI ADX Histogram Oscillator MT4 Indicator is a powerful tool for Forex traders seeking to measure trend strength and direction. By combining the Directional Movement Index (DMI) with the Average Directional Index (ADX), this indicator helps filter trading signals in trending and non-trending markets, providing clearer buy and sell signals.
Unlike standalone DMI signals, which can be choppy and misleading during sideways markets, the inclusion of ADX as a filter ensures that traders only act when the underlying trend is strong enough, improving overall trade quality and profitability.
How the Indicator Works
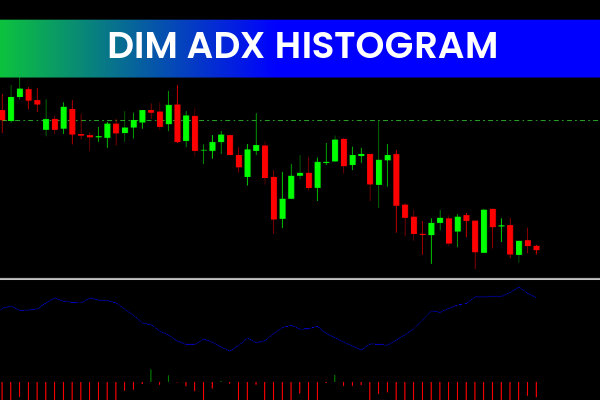
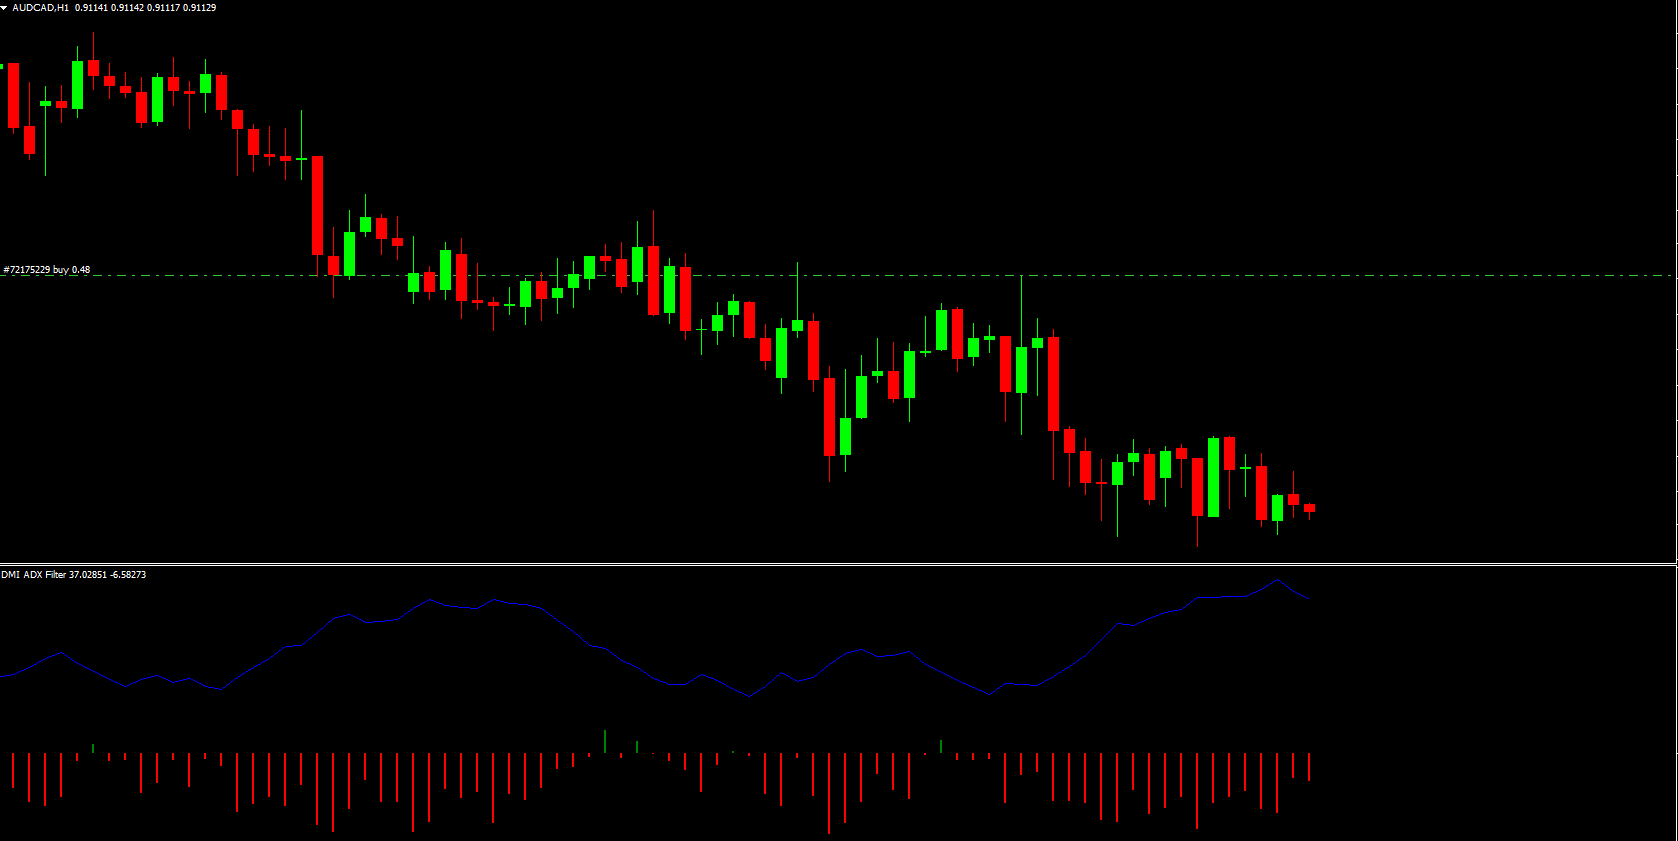
The indicator plots DMI histogram bars and an ADX line on your MT4 chart:
DMI Histogram:
Green bars above the zero line signal a bullish trend
Red bars below the zero line indicate a bearish trend
ADX Line:
Plotted above zero, showing the strength of the trend
Values above 20 indicate a strong trend
Values below 20 indicate a non-trending or weak market
Traders can use the DMI histogram for entry signals while relying on ADX as a filter to ensure they only trade when Trend Strength is sufficient.
Key Features of the Indicator
Trend Direction and Strength
Combines DMI and ADX to show both market direction and the momentum behind the trend.
Clear Visual Representation
Histogram bars for bullish/bearish trends and a line for ADX make interpretation intuitive.
All Timeframe Compatible
Works on any chart timeframe, from intraday Scalping to long-term swing trading.
Reliable Signal Filtering
Avoids false DMI signals during low-momentum periods by using ADX as a trend strength filter.
Beginner-Friendly
Simplifies complex trend analysis with straightforward visual cues.
How Traders Use the DMI ADX Histogram Oscillator
Entering Trades
Buy when green DMI bars appear and ADX is above 20
Sell when red DMI bars appear and ADX is above 20
Avoiding Sideways Markets
Ignore DMI signals when ADX is below 20 to reduce false signals.
Trend Analysis
Determine the strength of ongoing bullish or bearish trends before committing to positions.
Scalping and Swing Trading
Suitable for multiple trading styles—scalpers can use short-term timeframes, while swing traders benefit from higher timeframe trend confirmation.
Benefits of Using the DMI ADX Histogram Oscillator
High-Quality Signals: Combines two reliable indicators for better technical analysis.
Trend Clarity: Easily identifies trending vs. non-trending markets.
Versatile: Works on all MT4 timeframes for different trading strategies.
Enhanced Profit Potential: Reduces false trades by filtering low-strength trends.
Beginner-Friendly: Simple visual representation of trend direction and strength.
Final Thoughts
The DMI ADX Histogram Oscillator MT4 Indicator is a must-have for traders who rely on trend-following strategies. By merging the DMI for direction with the ADX for momentum, it provides a robust system to filter trades, avoid false signals, and improve overall profitability.
Whether you are a beginner learning to identify strong trends or an experienced trader refining your entry strategy, this indicator offers a clear and reliable way to navigate the Forex markets.
Explore more advanced MT4 indicators and trading tools at IndicatorForest.com.
FAQ
DMI ADX Histogram Oscillator displays Directional Movement Index and Average Directional Index as a histogram oscillator. It shows trend direction through +DI/-DI and trend strength through ADX in oscillator format.
Histogram format makes DMI/ADX changes more visible, shows momentum shifts clearly, helps identify when trends are strengthening or weakening, and provides clearer visual signals than line displays.
Positive histogram values indicate bullish trend (+DI dominant), negative values suggest bearish trend (-DI dominant). Histogram size shows trend strength - larger values indicate stronger trends.
Use for trend-following when histogram confirms trend direction, momentum trading on histogram crossovers, trend strength filtering using ADX component, and confirmation of other indicator signals.
Histogram display makes trend direction and strength immediately visible, provides clearer signals than line displays, helps identify momentum shifts quickly, and offers intuitive trend analysis.
Published:
Dec 17, 2025 02:07 AM
Category: