The DMI (Directional Movement Index) Indicator is a powerful technical tool for identifying market trends. Developed by Welles Wilder in 1978, this indicator analyzes high and low prices rather than closing prices, making it uniquely effective in determining trend direction.
How the DMI Indicator Works
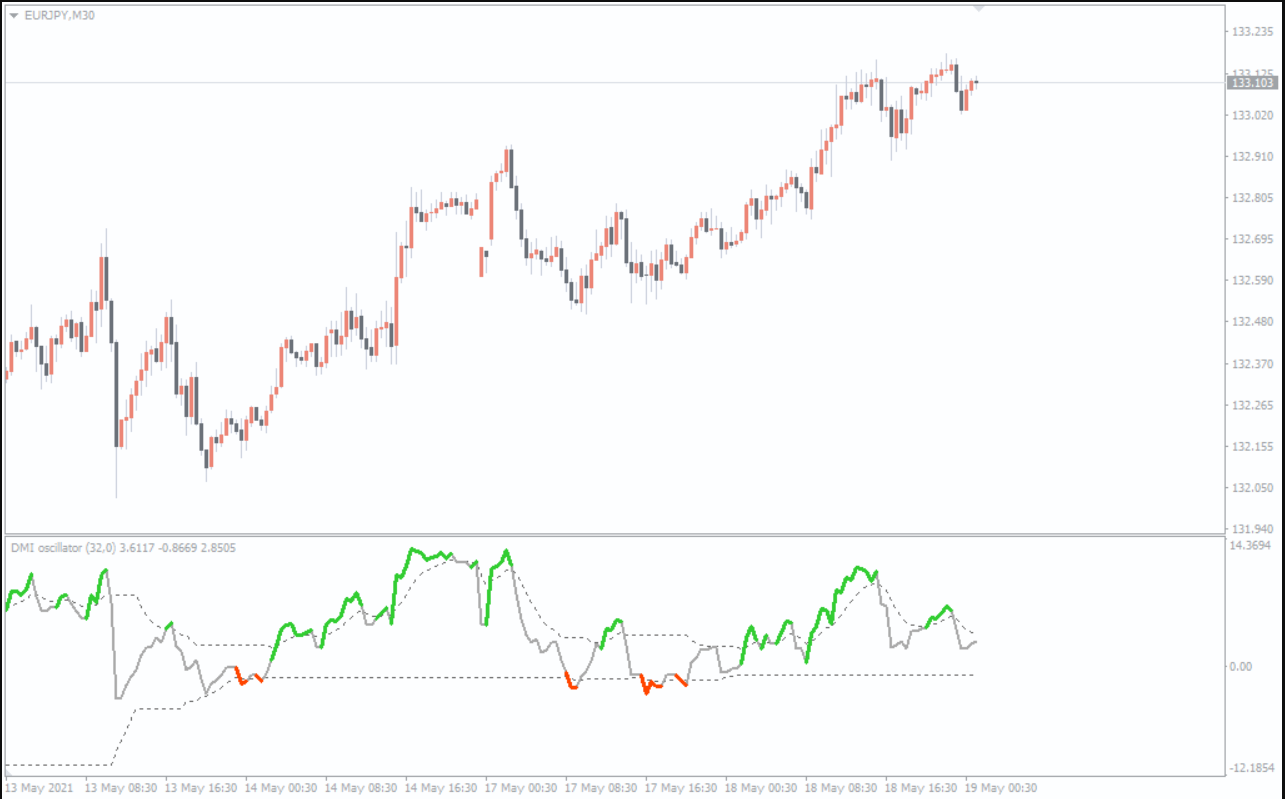
The DMI indicator examines the relationship between the most recent candlestick and the preceding one.
Bullish Direction: If the high and low of the current bar are higher than the previous bar, it indicates an upward trend.
Bearish Direction: If the high and low of the current bar are lower than the previous bar, it signals a downward trend.
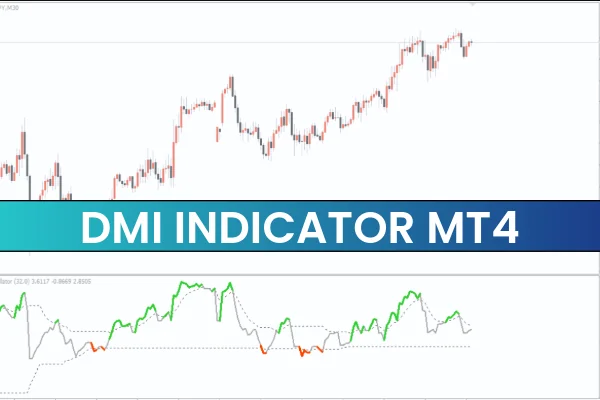
Visually, the DMI indicator uses three colors to represent market phases:
Grey: Consolidation or neutral market.
Green: Bullish phase, indicating potential buying opportunities.
Orange: Bearish phase, indicating potential selling opportunities.
Traders can adjust the DMI period and signal settings, as well as experiment with different timeframes, to reduce noise and improve accuracy.
DMI Indicator Trading Strategy
Buy Strategy
Wait for the indicator to turn green.
Ensure the indicator value is above zero.
Wait for a bullish candle to close.
Enter a long position with a stop-loss at the recent swing low.
Set the profit target at the next resistance level.
Sell Strategy
Wait for the indicator to turn orange.
Confirm the indicator value is below zero.
Wait for a bearish candle to close.
Enter a short position with a stop-loss at the recent swing high.
Set the profit target at the next support level.
Conclusion
The DMI Indicator MT4 is an essential tool for analyzing market trends and identifying bullish, bearish, and neutral phases. While it provides valuable insights, it should not be used as a standalone trading tool. Combining DMI with other indicators or Price Action analysis can help reduce risk and improve trading decisions.
FAQ
2 Downloads
Published:
Nov 26, 2025 23:18 PM
Category: