Unlock Consistent Profits with the Dorsey Inertia Indicator
In technical analysis, momentum is often the first thing traders look for, but sustainability is what actually builds wealth. The Dorsey Inertia Indicator is a sophisticated technical tool designed to filter out market noise and identify high-probability Trend Continuation opportunities. By focusing on the concept of "inertia"—the tendency of an object in motion to stay in motion—this indicator helps you stay on the right side of the market.
What is the Dorsey Inertia Indicator?
Developed by Thomas Dorsey, the Inertia indicator is essentially a smoothed version of the Relative Volatility Index (RVI). While standard momentum oscillators like the RSI can be erratic and prone to "whipsaws" in volatile markets, the Dorsey Inertia uses a linear regression curve to smooth out price fluctuations. This results in a much cleaner signal that only shifts when a genuine trend change is occurring.
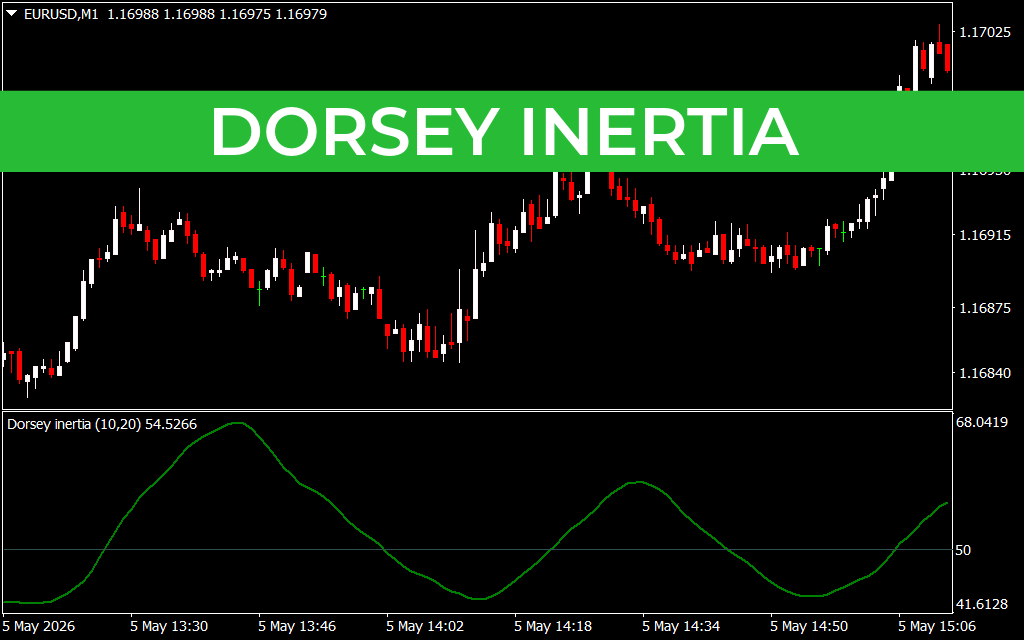
As seen in the technical display of EURUSDM1.png, the indicator appears as a smooth, oscillating line in a separate sub-window. It provides a clear visual representation of whether the market has enough underlying strength to maintain its current direction.
Key Benefits for Modern Traders
- Trend Confirmation: The primary use of the Dorsey Inertia is to confirm the strength of a trend. When the indicator is above the 50 level, it suggests the market has positive inertia (bullish). Below 50, it indicates negative inertia (bearish).
- Noise Reduction: Because it utilizes linear regression, it is far less sensitive to minor price spikes than traditional oscillators. This prevents traders from exiting profitable positions too early during minor pullbacks.
- Versatility: The Dorsey Inertia works across all timeframes. Whether you are Scalping the 1-minute charts or analyzing weekly trends, the logic of inertia remains a consistent physical law of the markets.
- Perfect for Confluence: It pairs exceptionally well with Price Action strategies. When price breaks out of a consolidation zone and the Dorsey Inertia crosses the 50 midline simultaneously, you have a high-confluence entry signal.
How to Use Dorsey Inertia in Your Strategy
The most effective way to trade with this tool is to treat the 50-level as the "Decision Zone."
- Bullish Setup: Look for the indicator to rise above 50. This confirms that the upward momentum has become an established trend. As demonstrated in EURUSDM1.png, a sustained move above this level often correlates with strong price rallies.
- Bearish Setup: When the line crosses below 50, it signals that the sellers have taken control and the downward momentum is likely to persist.
Traders should also look for "Inertia Extremes." When the indicator reaches very high or low levels, it doesn't necessarily mean a reversal is coming—it means the trend is incredibly strong. You should look to buy dips in a high-inertia environment rather than trying to pick a top.
Conclusion
The Dorsey Inertia Indicator is a must-have for traders who value clarity over complexity. By measuring the true velocity and commitment of market participants, it allows you to trade with the wind at your back. Stop guessing and start trading with the power of inertia today.
2 Downloads
Last Update:
May 05, 2026 19:41 PM
Published:
Jan 27, 2026 14:42 PM
Category: