Double Top Bottom Patterns Indicator

Double Top Bottom Patterns Indicator
Free

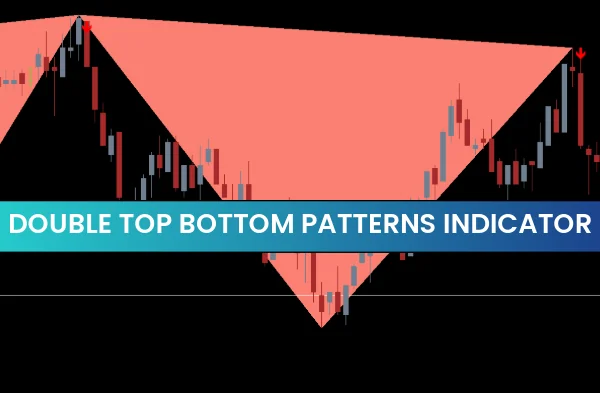
The Double Top Bottom Patterns Indicator for MT4 is a powerful tool designed to automatically scan price charts and identify high-probability double top and double bottom patterns. This indicator provides visual BUY and SELL arrow trading signals, enabling traders to focus on trading the pattern rather than searching for one manually.

Features of Double Top Bottom Patterns Indicator

Automatically detects double top and double bottom patterns

Provides BUY and SELL arrows after pattern completion and breakout

Supports all intraday, daily, weekly, and monthly timeframes

Suitable for new and advanced traders

Allows combination with Support And Resistance, trendlines, and channel breakouts for additional confirmation

How the Indicator Works

The indicator visually distinguishes patterns:

Bullish patterns (double bottoms): SKY BLUE

Bearish patterns (double tops): SALMON

BUY arrow signals: BLUE

SELL arrow signals: RED

Once a pattern completes and a breakout occurs, the indicator displays a trading signal, allowing traders to enter the market confidently.

Trading Double Bottom Patterns

A double bottom is a bullish reversal pattern, signaling the end of a downtrend and the start of an uptrend.

Entry: Place a BUY trade after breakout confirmation

Stop Loss: Below the entry point, approximately half the size of the pattern

Take Profit: Double the size of the pattern for optimal results

Trading Double Top Patterns

A double top is a bearish reversal pattern, indicating the end of an uptrend and the start of a downtrend.

Entry: Place a SELL trade after breakout confirmation

Stop Loss: Above the entry point, half the size of the pattern

Take Profit: Double the size of the pattern for maximum profit potential

Benefits of Using This Indicator

Quickly identifies reversal patterns without manual chart scanning

Generates clear BUY and SELL arrow trading signals

Works on multiple timeframes, including intraday and higher timeframes

Suitable for both beginner and advanced traders

Free to download and easy to install

Conclusion

The Double Top Bottom Patterns Indicator for MT4 is an efficient tool for spotting bullish and bearish reversal patterns. By providing automated BUY and SELL signals, it helps forex traders trade breakouts effectively. However, combining the indicator with additional confirmation methods, such as support and resistance or trendline analysis, can further enhance trading accuracy. Download the indicator today from IndicatorForest.com to start identifying high-probability patterns effortlessly.

FAQ

A powerful tool designed for MT4 to automatically scan price charts and identify high-probability double top and double bottom patterns providing visual BUY and SELL arrow trading signals enabling traders to focus on trading pattern rather than searching for one manually with double top being bearish reversal pattern and double bottom being bullish reversal pattern.

It automatically detects double top and double bottom patterns, provides BUY and SELL arrows after pattern completion and breakout, supports all intraday daily weekly and monthly timeframes, suitable for new and advanced traders, and allows combination with support and resistance trendlines and channel breakouts for additional confirmation. Indicator visually distinguishes patterns with bullish patterns (double bottoms) shown in SKY BLUE, bearish patterns (double tops) shown in SALMON, BUY arrow signals shown in BLUE, and SELL arrow signals shown in RED.

Double bottom is bullish reversal pattern signaling end of downtrend and start of uptrend. Entry: place BUY trade after breakout confirmation. Stop Loss: below entry point approximately half size of pattern. Take Profit: double size of pattern for optimal results. Once pattern completes and breakout occurs, indicator displays trading signal allowing traders to enter market confidently. This pattern appears at important support levels and provides high-probability reversal signals.

Double top is bearish reversal pattern indicating end of uptrend and start of downtrend. Entry: place SELL trade after breakout confirmation. Stop Loss: above entry point half size of pattern. Take Profit: double size of pattern for maximum profit potential. Indicator automatically scans price charts and identifies these patterns providing visual BUY and SELL arrow trading signals. This pattern appears at important resistance levels and provides high-probability reversal signals making it valuable for traders seeking to identify trend reversals.

Benefits include quickly identifying reversal patterns without manual chart scanning, generating clear BUY and SELL arrow trading signals, working on multiple timeframes including intraday and higher timeframes, suitable for both beginner and advanced traders, and free to download and easy to install. Indicator enables traders to focus on trading pattern rather than searching for one manually making it powerful tool for identifying high-probability double top and double bottom patterns.
1 Download

Published:

Dec 02, 2025 02:46 AM

Category:

We use cookies to personalize your experience. By continuing to visit this website you agree to our use of cookies

GDPR and cookie policy