The Elliot Wave Oscillator NRP Indicator is a powerful tool designed to help traders analyze price movements using the principles of Elliot Wave theory. It offers a clear and easy-to-read visual representation of market waves, making it simpler to identify trend direction, momentum strength, and potential reversal zones.
Because this version is non-repainting, traders receive consistent and reliable signals—an essential advantage for accurate market analysis. Whether you trade forex, indices, stocks, or commodities, this indicator enhances technical analysis and supports more confident trading decisions.
Discover More
Algo Trading
MetaTrader 4
MT4
Algorithmic trading
Forex market analysis
Backtesting software
Sentiment indicators subscription
Virtual Private Servers VPS
MT5 expert advisors
Trading software subscriptions
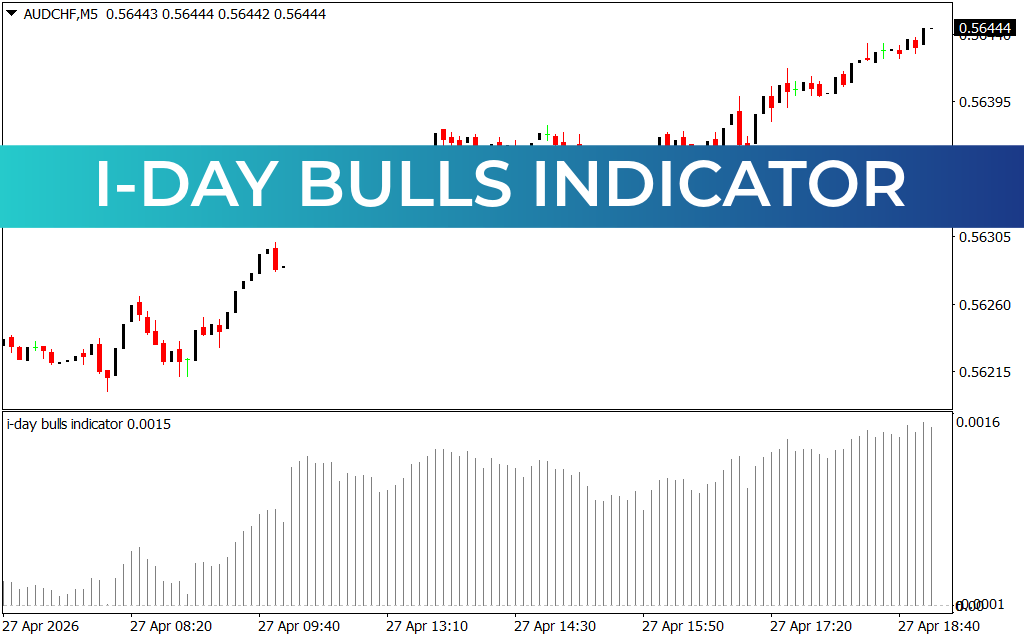
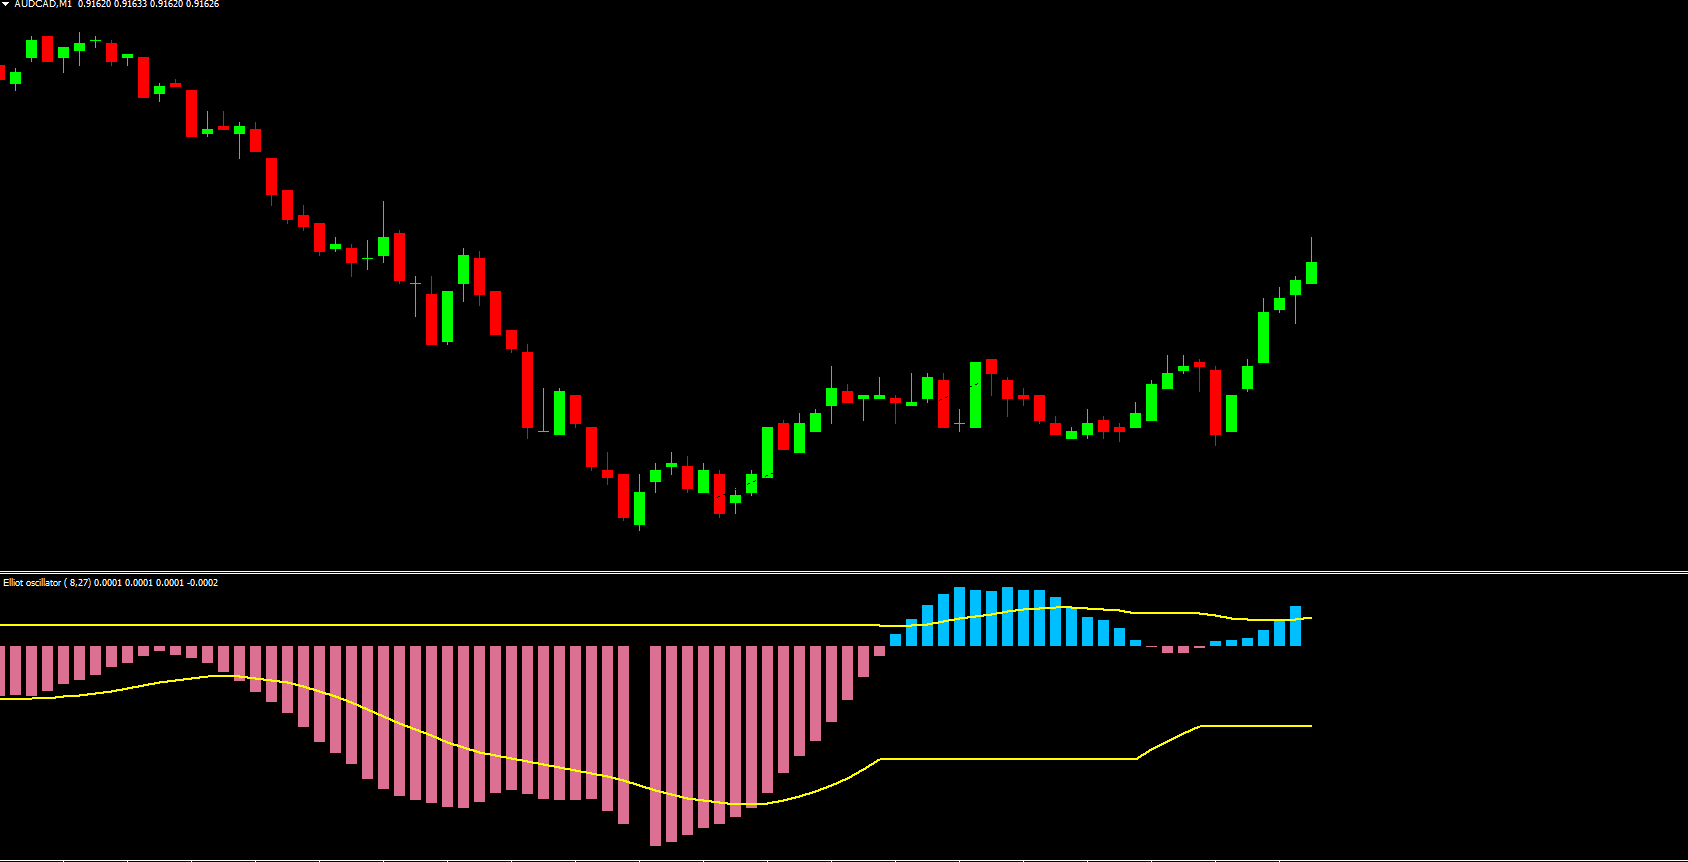
Elliot Wave Oscillator NRP Indicator Trading Signals
The indicator generates actionable insights by analyzing market cycles and price momentum:
Blue histogram bars → Indicate strong bullish momentum and potential buying opportunities.
Pink histogram bars → Signal strong bearish momentum, suggesting possible selling opportunities.
Additionally, the indicator includes a moving average signal line:
Histogram crossing above the signal line → Confirms bullish strength and Trend Continuation.
Histogram crossing below the signal line → Signals bearish momentum and further downside pressure.
This combination of wave analysis + momentum measurement makes the tool ideal for:
Trend-following strategies
Reversal setups
Wave-based entries and exits
Confluence trading with support/resistance
Conclusion
The Elliot Wave Oscillator NRP Indicator for MT4 is an essential tool for traders who rely on Elliot Wave principles to forecast market direction. Its blend of wave-based trend recognition and momentum tracking helps identify high-probability trade setups with greater precision. Thanks to its non-repainting structure, traders can depend on accurate and stable signals across all timeframes—making it suitable for both intraday and long-term strategies.
FAQ
5 Downloads
Published:
Dec 08, 2025 08:01 AM
Category: