Unlocking Market Velocity with the Ema Angle Zero Alert Indicator
In the technical analysis of financial markets, moving averages are heavily relied upon to smooth out Price Action and reveal the primary direction of a trend. However, conventional moving averages suffer from an inherent flaw: they tell you where the price has been, but they fail to measure the direct velocity or trajectory of the current move. The Ema Angle Zero Alert Indicator addresses this limitation directly by calculating the literal mathematical slope—or angle—of an Exponential Moving Average baseline, transforming a standard lagging tool into a powerful, real-time momentum filter.
The Mechanics Behind Ema Angle Calculations
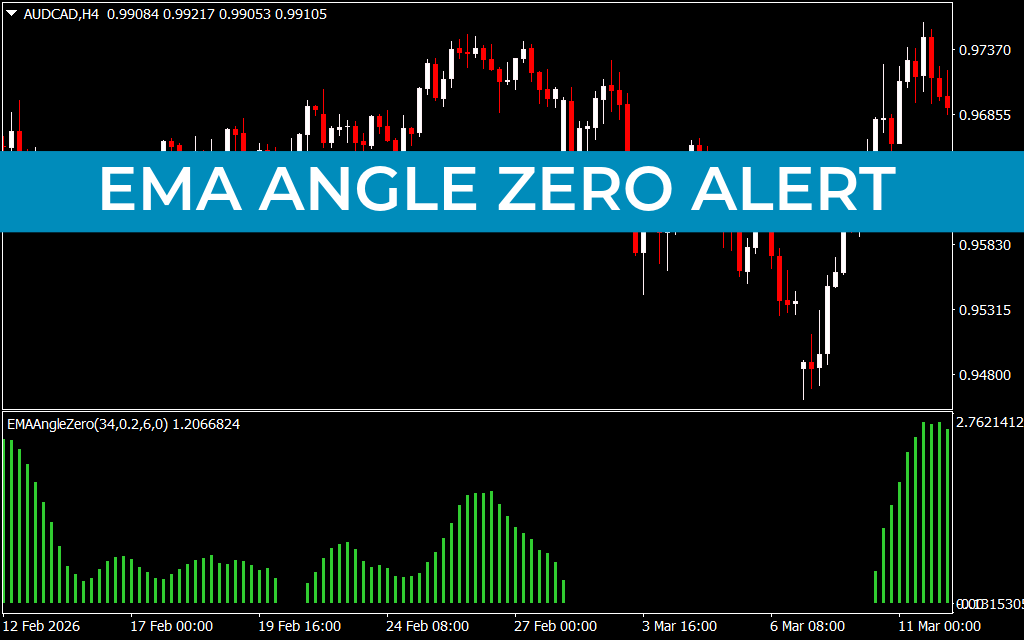
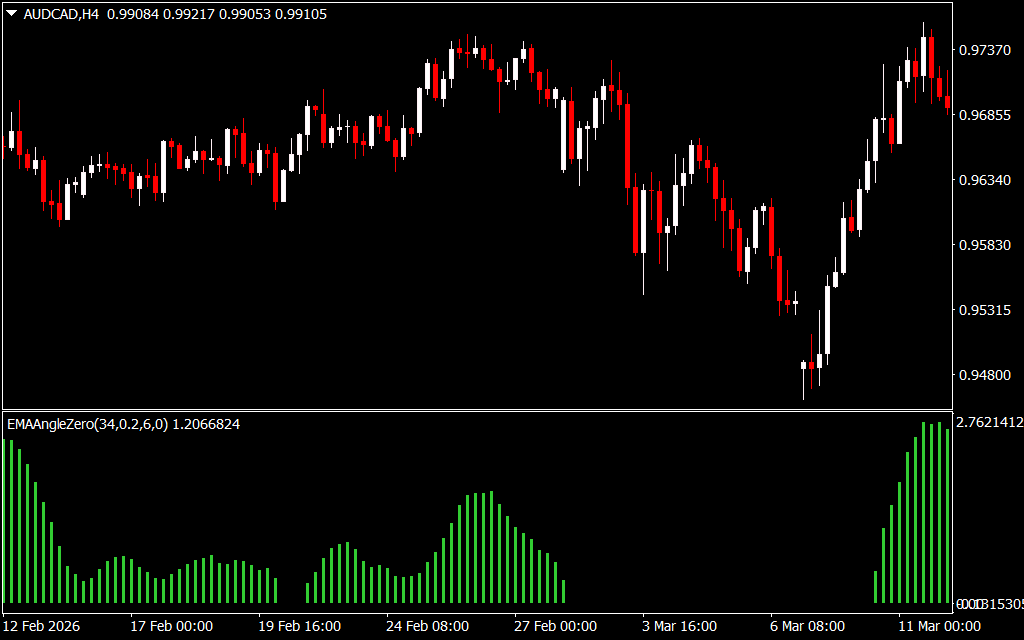
The core engine of this indicator strips away chart subjectivity by processing price action through a strict geometric lens. Standard technical setups often feature baseline values like a 34-period EMA. The Ema Angle Zero Alert Indicator isolates the rate of change of this EMA against a static, horizontal zero axis line.
Instead of cluttering your primary chart with overlapping lines, the algorithm projects its structural data into a dedicated technical sub-window via an intuitive histogram:
- Green Histogram Bars: Signal a positive mathematical angle moving steadily above the zero bound threshold. This structure points to an active, expanding bullish trend backed by institutional volume.
- Absence of Bars or Dead Zones: Signal a flat, horizontal slope or a contraction phase. When the histogram drops out entirely and returns to the 0.0000000 plane, it warns you that the market is trading sideways within a weak consolidation block.
By analyzing the steepness of the histogram peaks, day traders can gauge whether a macro move is accelerating dynamically or entering a distribution phase.
Strategic Trading Application and Risk Management
Integrating the Ema Angle Zero Alert system into your daily trading protocol provides distinct, mechanical rules for trade filter and execution:
- Breakout Qualification: When a currency pair breaks out of a technical chart pattern, check the sub-window histogram. If the green bars are actively scaling higher, the breakout possesses true momentum. If the bars remain flat, it is highly likely a false breakout or a market trap.
- Trend Following and Trailing: The building blocks of the histogram serve as an ideal trail management guide. In a strong uptrend, as seen on macro timeframes, you can confidently let your profits run as long as the green histogram structure sustains its expansion height.
- Spotting Momentum Exhaustion: If price action prints a structural higher high on the main chart, but the indicator sub-window registers a lower peak, a distinct momentum divergence is unfolding. This signals an early warning alert to tighten stop-losses or extract profits before a Trend Reversal prints.
Cross-Timeframe Alignment from M5 to H4
The Ema Angle Zero Alert Indicator is exceptionally versatile, proving highly valuable for both short-term scalpers on the 5-minute (M5) charts and swing traders analyzing the 4-hour (H4) charts. By aligning your timeframes—such as confirming a steep, positive angle structure on the H4 chart and utilizing minor pullbacks on the M5 chart to execute entries—you effectively trade alongside institutional volume while keeping your initial stop-loss extremely tight.
3 Downloads
Last Update:
May 14, 2026 21:08 PM
Published:
Jan 22, 2026 01:21 AM
Category: