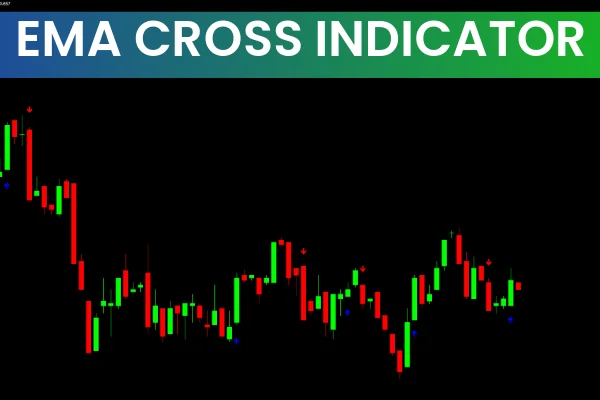
The EMA Cross Indicator for MetaTrader is a powerful tool for forex traders seeking clear signals for potential price reversals. Using two exponential moving averages (EMAs), the indicator identifies when they cross, signaling a possible bullish or bearish move. Unlike traditional moving averages, the EMAs are not plotted on the chart; instead, the indicator displays colored arrows for easy interpretation.
How the EMA Cross Indicator Works
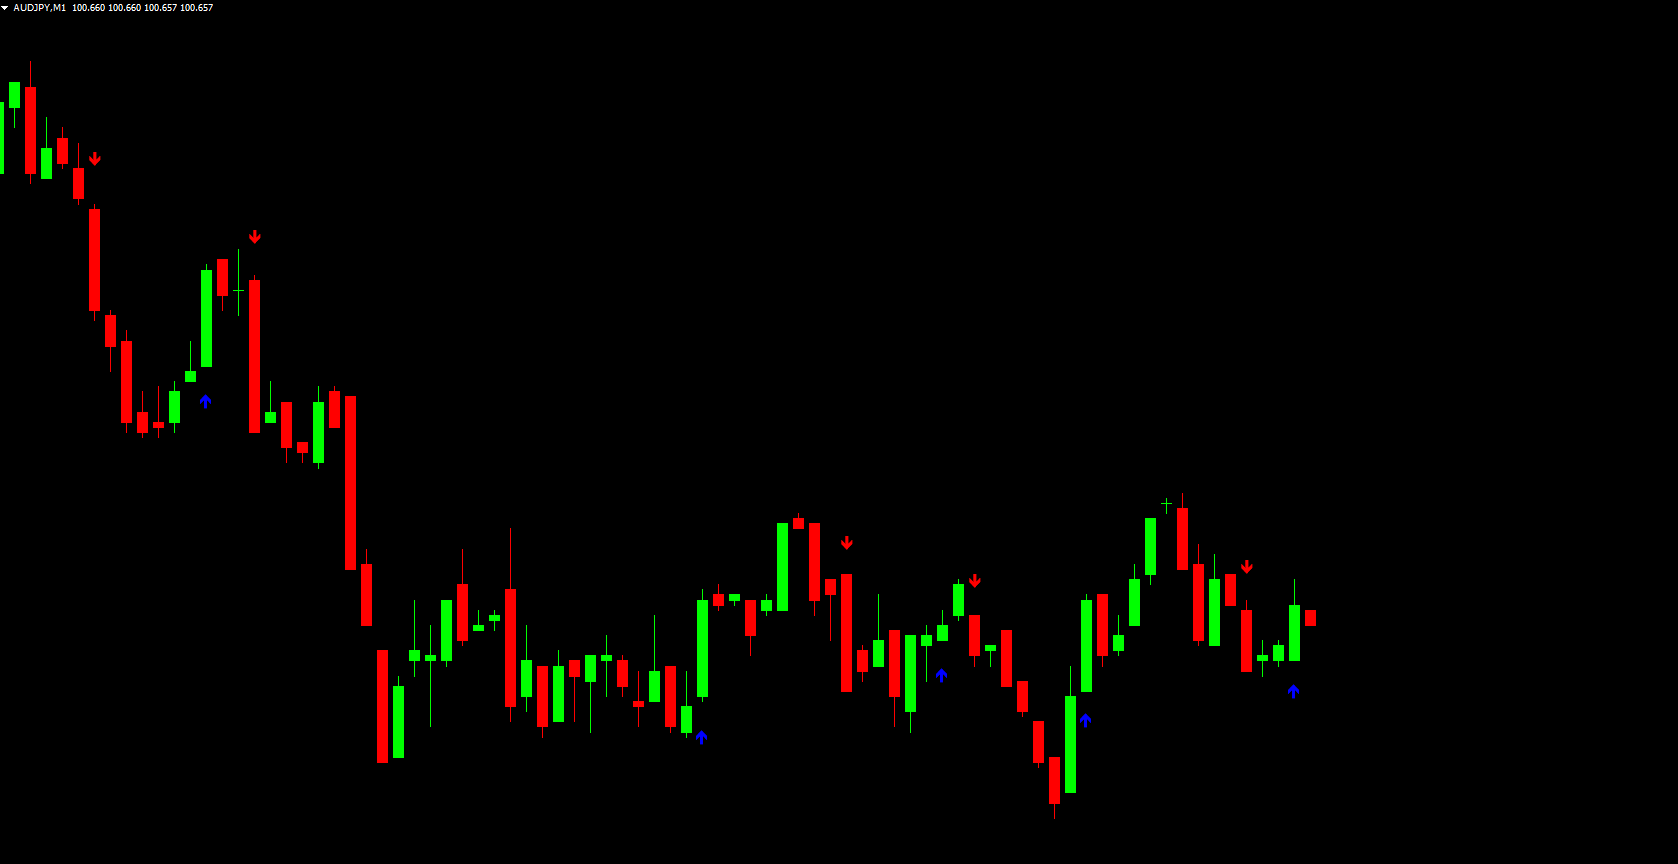
Blue Arrow: Indicates a potential bullish move (BUY signal).
Red Arrow: Indicates a potential bearish move (SELL signal).
This design makes it easy for novice, intermediate, and experienced traders to quickly spot high-probability trade setups. The indicator works well for multiple trading styles, including Scalping, intraday/day trading, and swing trading.
How to Trade With the EMA Cross Indicator
Trend Confirmation: Before entering a trade, identify the market trend using Price Action. For bullish setups, look for higher highs and higher lows; for bearish setups, look for lower highs and lower lows.
Signal Verification: Enter a trade when the indicator paints a BLUE arrow for BUY or a RED arrow for SELL.
Use Confluence: Combine the EMA Cross signal with price action patterns such as bullish/bearish engulfing candles, pin bars, or other indicators to increase the probability of a successful trade.
Example Trade: On an MT4 chart, if the market is forming a bullish trend and a BLUE arrow appears, this indicates an optimal entry point for a BUY position. Conversely, during a bearish trend, a RED arrow indicates a SELL entry.
Best Practices
Do not rely solely on the EMA Cross Indicator for trade entries.
Combine it with support/resistance levels, trendlines, or other indicators for confirmation.
Adjust your stop loss and take profit levels based on market volatility and timeframe.
Benefits of the EMA Cross Indicator
Clear Visual Signals: Blue and red arrows make trading decisions easier.
Versatile: Works across multiple timeframes and trading styles.
User-Friendly: Ideal for beginners and advanced traders alike.
Free Download: Available directly on IndicatorForest.com.
Conclusion
The EMA Cross Indicator for MT4 is an essential tool for traders looking to identify potential trend reversals. With its clear buy and sell signals and compatibility with multiple trading styles, it is perfect for scalping, intraday, and swing trading. For a free download and to explore more indicators, visit IndicatorForest.com.
FAQ
1 Download
Published:
Nov 11, 2025 22:49 PM
Category: