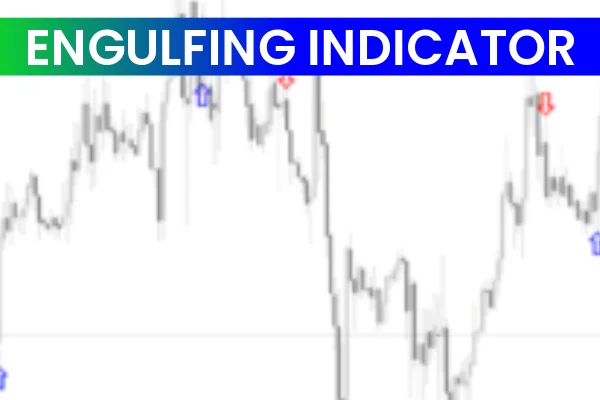
The Engulfing Indicator for MT4 is designed to automatically detect bullish and bearish engulfing candlestick patterns, which often signal a potential reversal in price direction. Engulfing patterns provide valuable insight into market pressure—whether buyers are taking control or sellers are dominating.
Instead of manually scanning charts for engulfing candles, this indicator performs the analysis for you. It highlights strong reversal opportunities by marking bullish engulfing patterns with blue arrows and bearish engulfing patterns with red arrows. This makes it highly useful for both new and experienced Forex traders.
Understanding Engulfing Candles
Engulfing candles form when a candlestick completely covers the body of the previous candle. This shift in price movement shows a sudden change in strength between buyers and sellers:
Bullish Engulfing: Buyers overpower sellers, often leading to upward momentum
Bearish Engulfing: Sellers push prices lower after overtaking buyer pressure
The Engulfing Indicator clearly marks these conditions, letting traders focus more on execution and less on searching for patterns.
Features of the Engulfing Indicator
The indicator includes several helpful features that enhance trade analysis:
Versatile Across All Timeframes
Works effectively on M1 to monthly charts, suitable for scalpers, day traders, and swing traders.
Compatible With All Currency Pairs
You can apply it to Forex pairs, indices, metals, or crypto assets on MT4.
Customizable Settings
Users can adjust color schemes, alert types, and sensitivity levels based on trading preference.
Clear Arrow Signals
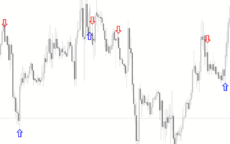
Blue arrows represent bullish reversal signals, while red arrows mark bearish reversal setups.
How the Engulfing Indicator Works
Once applied to the chart, the indicator continuously scans Price Action to identify engulfing formations. It instantly displays arrows above or below the candle, giving you a clean and easy-to-read signal.
These signals work exceptionally well when combined with:
Support And Resistance levels
Trend lines
Moving averages
Market Structure analysis
This ensures traders avoid false setups and improve accuracy.
Buy and Sell Strategy Using the Engulfing Indicator
Bullish Signal (BUY)
Look for a blue upward arrow below a bullish engulfing candle.
Enter the trade on the next candle.
Place a stop-loss below the engulfing pattern or recent swing low.
Exit when the opposite pattern appears at a key level or when your risk-to-reward target is met.
Bearish Signal (SELL)
Watch for a red downward arrow above a bearish engulfing pattern.
Enter on the next candle.
Place your stop-loss above the engulfing candle or recent swing high.
Close the position when an opposite signal forms or when price reacts at a major support area.
Exit Strategy
Since engulfing patterns occur frequently, traders should use them with confirmation tools such as support/resistance zones or trend filters. The best exits occur when an opposite engulfing pattern appears at a strong technical level.
Why Traders Use the Engulfing Indicator
Eliminates the need for manual pattern searching
Enhances decision-making with clear visual signals
Supports multiple timeframes and trading styles
Helps traders increase accuracy in identifying reversals
Whether you trade trends, breakouts, or pullbacks, the Engulfing Indicator provides clean, high-quality signals that help streamline your strategy.
Conclusion
The Engulfing Indicator for MT4 makes it easy to spot bullish and bearish engulfing patterns and offers reliable reversal signals through intuitive arrow markings. It works exceptionally well alongside support and resistance tools and helps traders uncover high-quality opportunities. Explore more MT4 indicators and trading tools at IndicatorForest.com.
FAQ
5 Downloads
Published:
Dec 11, 2025 03:08 AM
Category: