The Engulfing Indicator for MT4 is a powerful tool designed to automatically scan your charts and detect the popular engulfing candlestick patterns. If you are a technical trader, you've probably come across the term engulfing pattern (eng-pattern) — a Price Action signal where one candlestick completely consumes the previous one, indicating potential trend reversal.
For traders who rely on clean Market Structure, this indicator removes the manual stress of pattern-spotting and complements tools like the Forex Reversal Indicator and Super Arrow Indicator.
What Is the Engulfing Indicator for MT4?
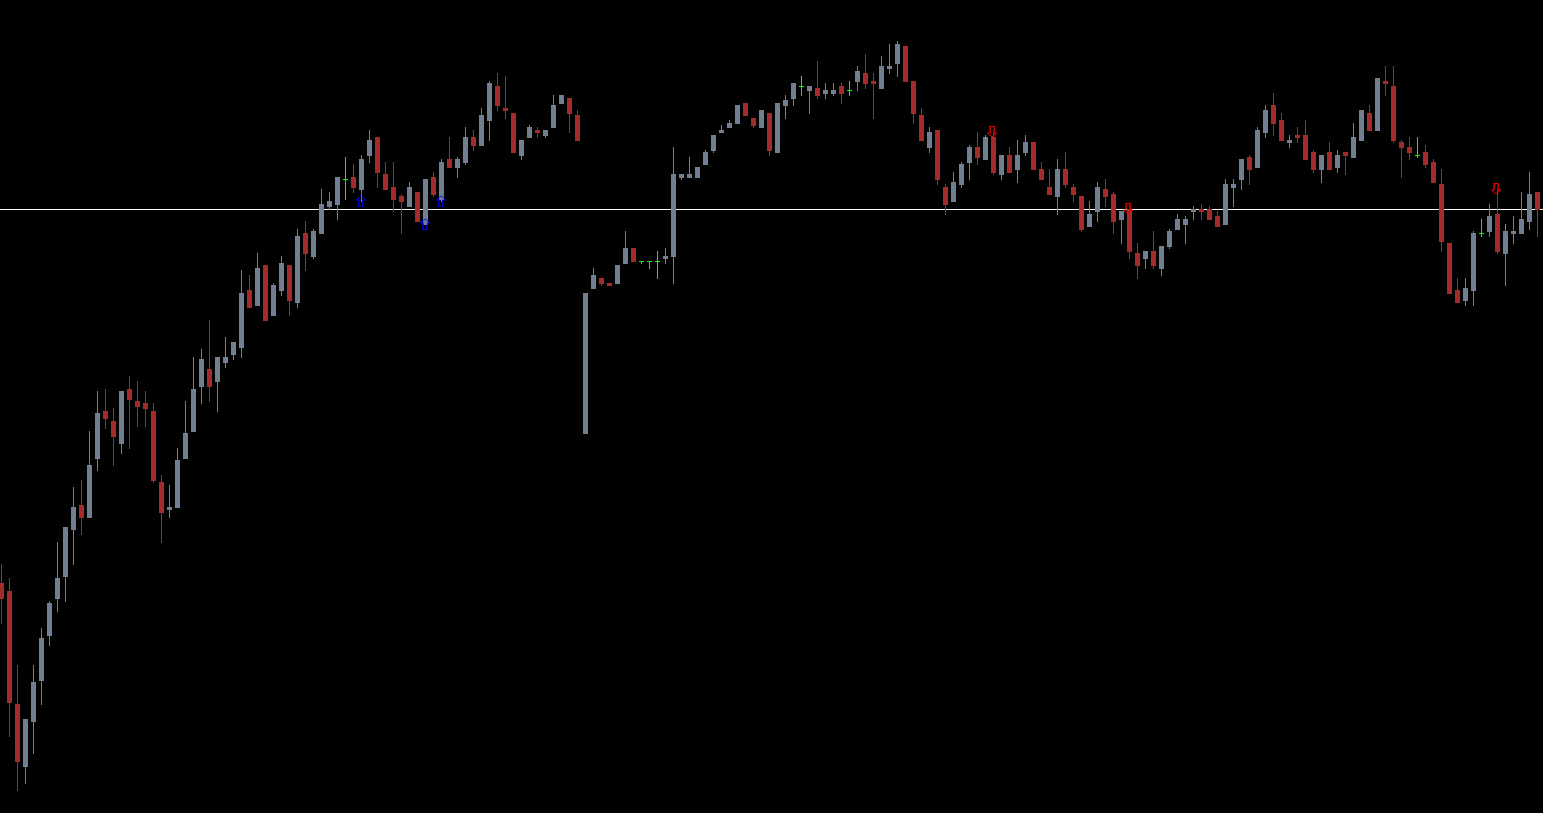
The Engulfing Indicator identifies both bullish and bearish engulfing patterns, labels them clearly, and plots arrows directly on your chart.
How it works:
Blue Arrow → Bullish Engulfing (buyers dominate)
Red Arrow → Bearish Engulfing (sellers dominate)
Works on all currency pairs and all timeframes
Detects patterns automatically — no manual scanning needed
Includes adjustable settings to match your strategy
From personal experience, installation is straightforward: drop the file into your MQL4 → Indicators folder, refresh MT4, attach it to your chart, and it instantly plots signals on historical data for easy backtesting.
Why Engulfing Patterns Matter
The engulfing pattern reflects a shift in market pressure:
Bullish Engulfing: Buyers overpower sellers, pushing the price upward.
Bearish Engulfing: Sellers overpower buyers, driving price downward.
These patterns appear at:
Trend reversals
Important support & resistance levels
Counter-trend pullbacks
High-probability turning zones
The Engulfing Indicator marks these areas precisely using arrows so traders can quickly react.
Using the Engulfing Indicator in Your Trading
Identify the arrow
Blue = bullish signal (consider buys)
Red = bearish signal (consider sells)
Confirm with additional tools
The indicator is powerful, but best used with:
Moving averages
Trendlines
Market structure
Volume or oscillator confirmation
In live trading, combining the indicator with a moving average filter significantly reduces false signals.
Trade with confluence
The highest-probability setups occur when:
Bullish engulfing forms at support
Bearish engulfing forms at resistance
The signal aligns with the overall trend
Price rejects key psychological levels
Example:
On GBPAUD, the indicator plotted a bearish engulfing after a double touch at resistance. This produced a strong downward continuation — a textbook high-probability reversal.
Pros and Cons of the Engulfing Indicator
Pros
Extremely easy to use
Great for beginners and advanced traders
Clear visual arrows
Works on all pairs & timeframes
Helps quickly spot reversal zones
Customizable settings
Cons
Can give false signals in ranging markets
Shouldn’t be used alone
Lower timeframes may show many signals
Requires trader discretion
Who Should Use This Indicator?
The Engulfing Indicator is ideal for:
Beginners learning candlestick patterns
Day traders and swing traders
Price action traders
Trend Reversal traders
Anyone who wants automated pattern detection
Conclusion
The Engulfing Indicator for MT4 is one of the most reliable pattern-recognition tools for traders using price action strategies. It removes the manual effort of scanning charts, highlights clear buy/sell signals, and works well when combined with additional filters.
Install it, let it detect patterns automatically, and use proper confirmations to increase accuracy. With practice, this indicator can become a core part of your reversal trading strategy.
For deeper insight into price imbalances, don’t forget to check our article on Gap Trading Strategies as well.
FAQ
5 Downloads
Published:
Dec 02, 2025 03:05 AM
Category: