Mastering Elliot Wave Cycles with the EWO Indicator
In the world of professional technical analysis, identifying the beginning of a powerful market trend is the ultimate goal. While traditional oscillators like the Relative Strength Index (RSI) or Stochastic indicators are excellent at identifying overbought and oversold conditions, they frequently fall flat when a market enters a strong, sustained macro trend. The EWO Indicator (Elliott Wave Oscillator) addresses this issue directly by using structural price velocity to track and label underlying market cycles, providing retail and institutional traders alike with a definitive roadmap of market momentum.
The Architecture Behind the Elliott Wave Oscillator
At its structural core, the EWO Indicator strips away market noise by computing the difference between two distinct moving averages. The technical formula measures the mathematical variance between a short-term 5-period Simple Moving Average (SMA) and a long-term 34-period Simple Moving Average (SMA) based on the median price of each candle.
Instead of drawing tangled lines across the primary chart, the indicator projects this momentum differential into a dedicated technical sub-window panel as a continuous signal wave line or histogram centered around a critical 0.00 zero-bound threshold:
- Sustained Moves Above Zero: Signal dominant bullish velocity. When the wave line climbs rapidly into positive territory, it confirms that short-term buying pressure is heavily outstripping the macro historical baseline.
- Sustained Moves Below Zero: Signal accelerating bearish velocity. A plummeting signal line below the zero axis warns traders that aggressive institutional markdown phases are currently underway.
Utilizing the EWO Indicator for Advanced Trend Analysis
The beauty of the EWO tool lies in its capability to objectively identify structural market cycles, helping traders locate high-probability entry windows and avoid major market traps:
- Pinpointing Wave 3 Explosions: According to classic Elliott Wave theory, Wave 3 is the longest and most explosive phase of a trend. The EWO indicator registers this velocity perfectly; the absolute peak or valley of the oscillator line invariably identifies the strongest point of the Wave 3 expansion.
- Trading Wave 4 Pullbacks: When the oscillator wave line peaks and begins a steady retracement back toward the zero line, it signals an institutional pause, often marking a structural Wave 4 corrective phase. Savvy day traders look for price to stabilize at primary support levels during this pullback to position themselves for the ensuing breakout.
- Spotting Structural Divergences: If Price Action prints a higher high on the main chart, but the EWO signal line prints a significantly lower peak, a major bearish momentum divergence has formed. This structural decay indicates early trend exhaustion and serves as a strict signal to tighten risk parameters or collect profits.
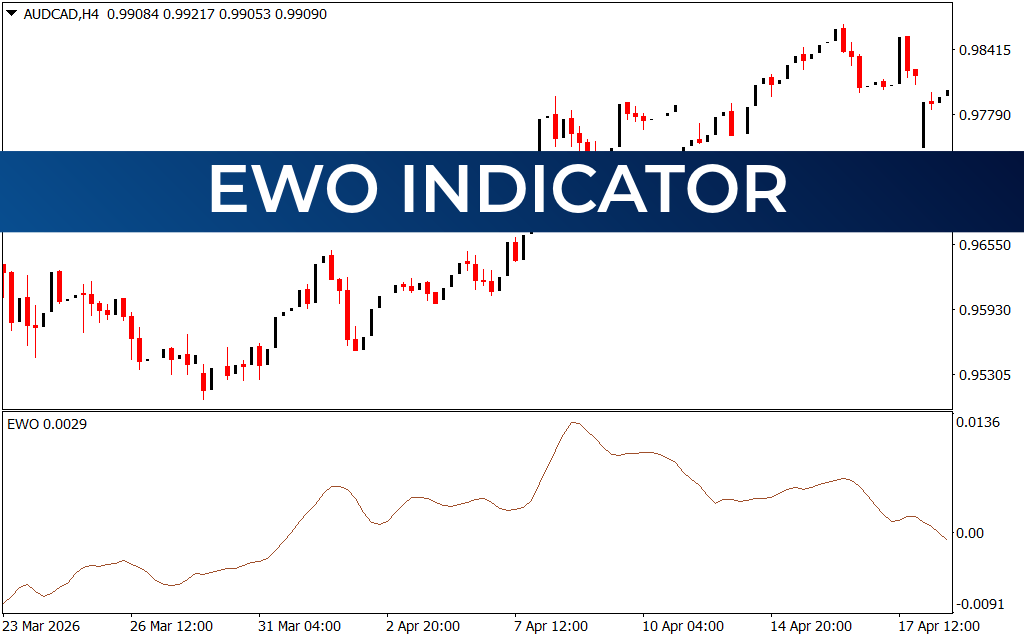
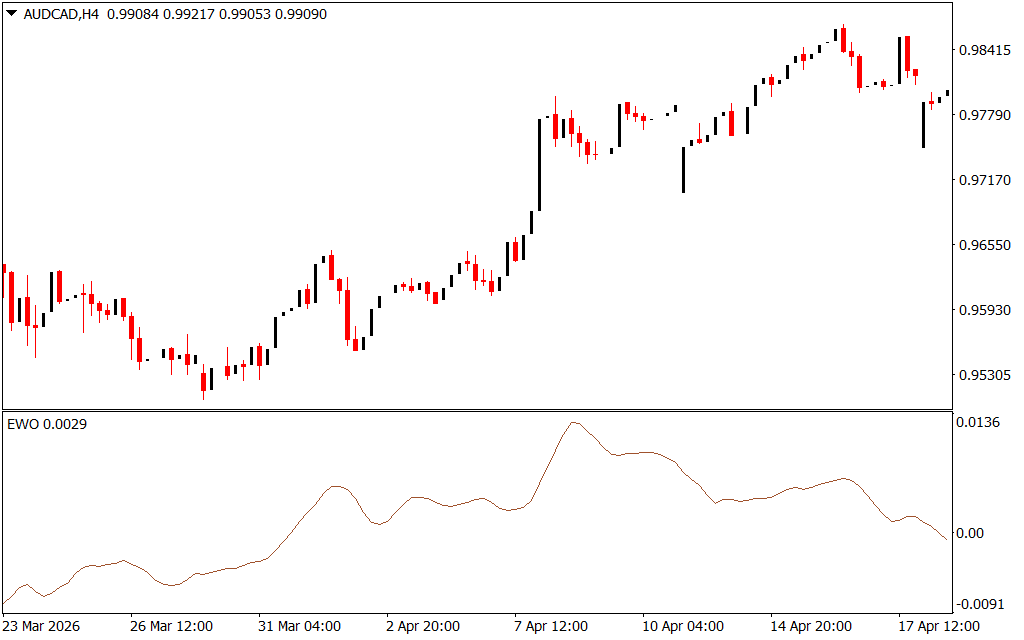
Swing Trading Optimization on the 4-Hour (H4) Chart
While highly adaptive across multiple chart layouts, the EWO Indicator delivers exceptional mechanical clarity on macro timeframes like the 4-hour (H4) chart. As displayed on the AUD/CAD H4 structure, the indicator neatly maps major cyclical swings over weeks of price action. By isolating the true underlying momentum trend from short-term retail noise, swing
1 Download
Last Update:
May 14, 2026 21:10 PM
Published:
Jan 22, 2026 01:16 AM
Category: