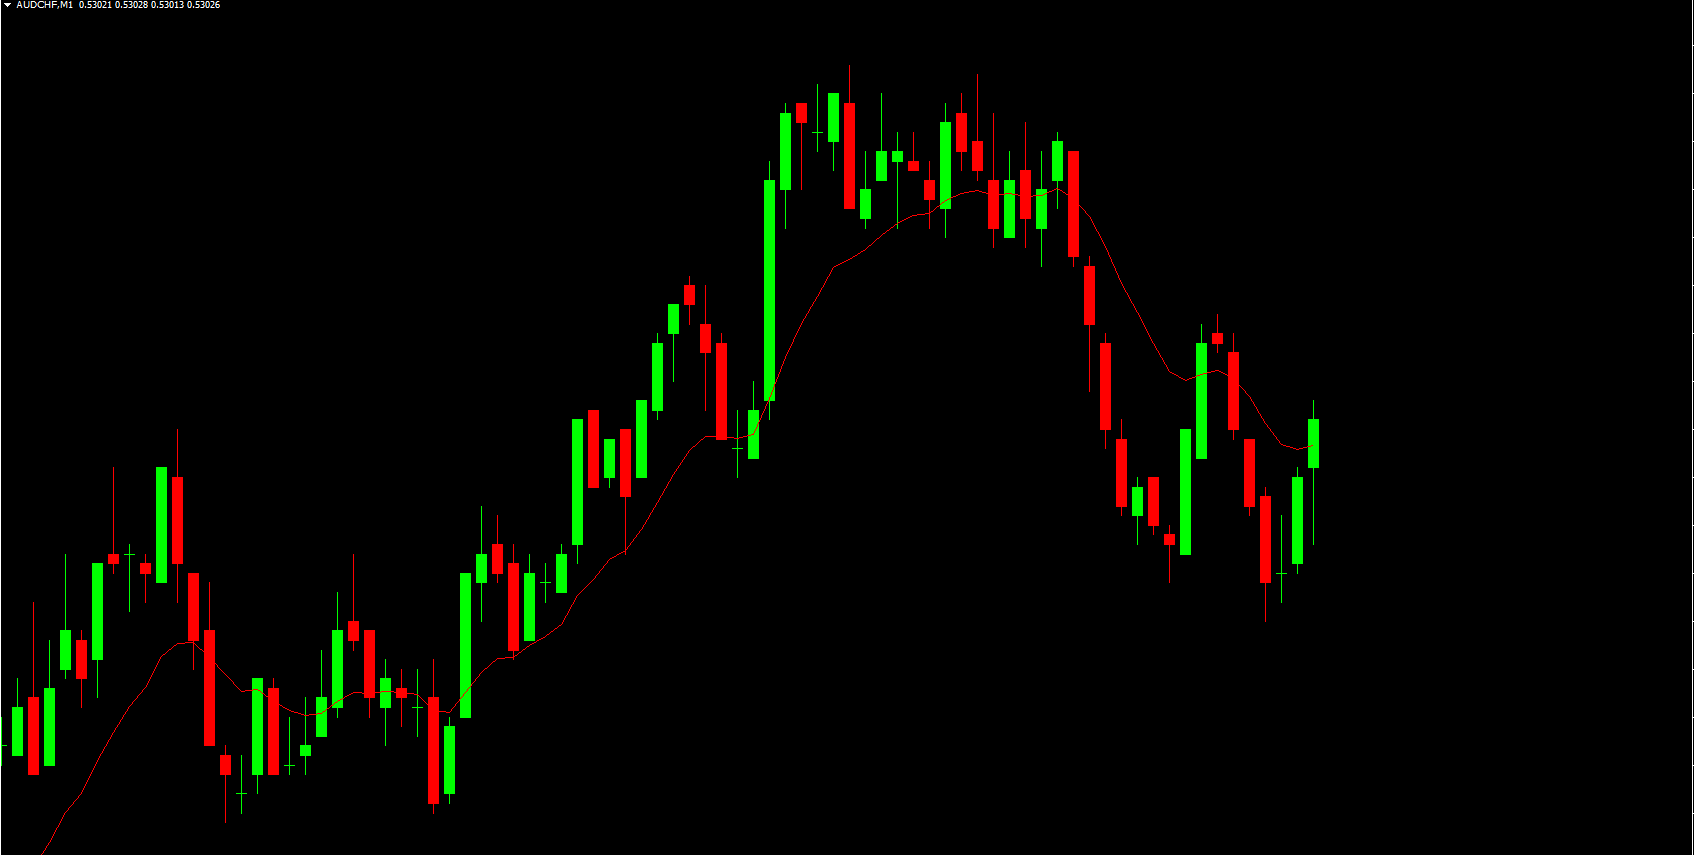
The Exponential Moving Average Indicator for MT4, commonly known as the EMA Indicator, is one of the most widely used tools in forex technical analysis. Because the indicator reacts quickly to price changes, traders rely on it to understand trend direction, reversal points, and key entry or exit levels. Incorporating the EMA Indicator into your strategy allows you to observe Market Structure more effectively and follow momentum with greater accuracy. However, traders should avoid using the EMA in isolation; instead, it works best when combined with Price Action, support/resistance zones, or other technical indicators.
Features of the Exponential Moving Average Indicator
Accurate Trend Tracking
The EMA uses a formula that gives more weight to recent prices, making it more responsive than traditional moving averages. This responsiveness allows traders to detect trend changes early and adjust their positions accordingly. Scalpers and intraday traders especially appreciate the EMA because it quickly reflects market shifts.
Adjustable Parameters
One of the strengths of the EMA Indicator is its flexibility. Traders can adjust its period settings—such as 9 EMA, 20 EMA, 50 EMA, or 200 EMA—to fit strategies for scalping, day trading, or longer-term swing trading. These settings allow users to customize trend sensitivity and improve signal quality.
Works on All MT4 Timeframes
Whether you're analyzing 1-minute charts for scalping or daily charts for long-term Trend Continuation setups, the EMA Indicator performs consistently. Its ability to adapt across timeframes makes it a dependable technical tool for both beginners and experienced forex traders.
Benefits of Using the EMA Indicator
Determines Trend Direction Clearly
The EMA excels at showing trend direction. When the price consistently stays above the EMA line, the market generally moves in a bullish trend. Conversely, when price action remains below the EMA, bearish momentum is usually dominant. This simple interpretation helps traders avoid entering trades against the prevailing trend.
Highly Responsive to Price Movement
Because the EMA prioritizes recent data, it detects changes faster than a Simple Moving Average (SMA). This helps traders respond quickly to developing conditions, especially in high-volatility markets. The sensitivity of the EMA is useful for confirming price corrections, trend continuations, and potential reversals.
Reliable Entry and Exit Zones
Many traders use EMA crossovers—such as 9 EMA crossing 21 EMA—to identify buy and sell opportunities. These crossover techniques help traders time entries more effectively, especially when combined with significant chart levels like swing highs, swing lows, or structure breaks.
Improves Trading Discipline
Using EMAs encourages traders to follow objective rules rather than emotional decisions. Trend-following strategies based on EMA lines help reduce noise, filter false signals, and maintain a more structured approach to market analysis.
How to Use the EMA Indicator Effectively
Combine With Price Action
The EMA works best when paired with tools such as candlestick patterns, support/resistance, or market structure. For example, a bullish engulfing candle above the 20 EMA often indicates strong upward momentum.
Use Multiple EMAs for Clarity
Many traders use combinations like:
9 & 21 EMA – for short-term trend direction
20 & 50 EMA – for swing trading
50 & 200 EMA – for long-term trend confirmation
These combinations provide confirmation when the market trend is aligning across different time horizons.
Avoid Trading EMA Crossovers During Ranging Markets
EMA signals are more reliable in trending markets. In sideways or low-volatility conditions, EMA lines may cross frequently without producing meaningful direction. Always confirm conditions using structure or additional indicators.
Call to Action
Enhance your trading strategy with high-quality MT4 indicators.
Visit IndicatorForest.com to download more powerful forex tools.
FAQ
Published:
Dec 12, 2025 04:32 AM
Category: