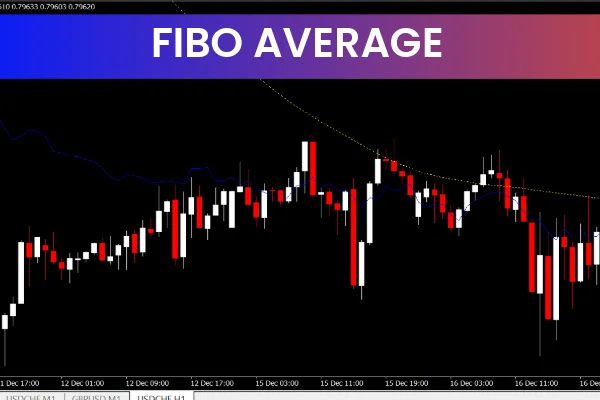
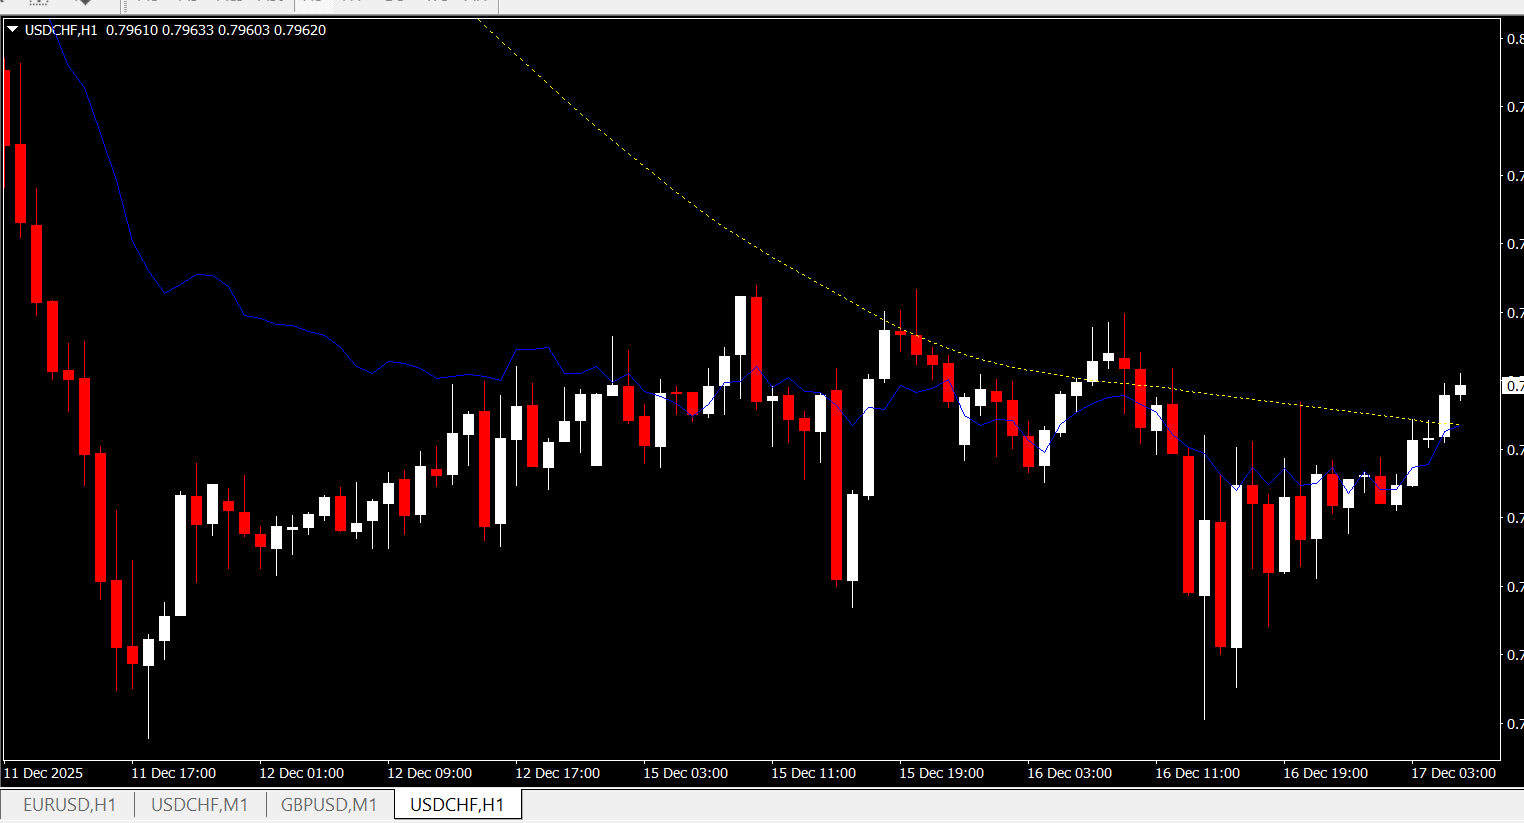
The Fibo Average Indicator MT4 is a widely used and highly regarded Forex tool that helps traders identify potential Support And Resistance levels using Fibonacci retracements. This free indicator simplifies the process of determining key market levels, making it easier for traders of all experience levels to plan their entries and exits effectively
By incorporating Fibonacci levels into its calculations, the Fibo Average Indicator provides critical insights into price behavior, allowing traders to make more singnal informed decisions. Whether you're a beginner or an experienced trader, this tool can enhance your trading strategy and improve your trade accuracy.
What is the Fibo Average Indicator MT4?
The Fibo Average Indicator MT4 leverages the power of Fibonacci retracement levels to mark key price levels where support or resistance might occur. This indicator automatically plots the following five Fibonacci levels on the price chart:
23.6%
38.2%
50%
61.8%
78.6%
These levels are widely used in technical analysis to predict potential Trend points or continuation areas in the market. By identifying when the price approaches these levels, traders can anticipate potential price movements and take advantage of them.
How the Fibo Average Indicator MT4 Works
The Fibo Average Indicator works by calculating and displaying five key Fibonacci retracement levels. Here's how it functions:
Plotting Fibonacci Levels: The indicator automatically plots the Fibonacci levels based on the most recent price movement.
Identifying Support and Resistance: These levels are considered significant support and resistance zones, where price may either reverse or continue the current trend.
Signal Alerts: When the price reaches one of these levels, the indicator generates a signal, alerting the trader to a potential Trend Reversal or continuation.
This process is designed to help traders anticipate future price movements by recognizing areas where price is likely to face either buying or selling pressure.
How to Use the Fibo Average Indicator MT4 Effectively
The Fibo Average Indicator is versatile and can be used in several ways to enhance your trading strategy:
1. Identifying Potential Reversals
When the price reaches a Fibonacci level (especially the 50% or 61.8% retracement), it can signal a potential reversal.
If the price starts to show signs of reversing at these levels, traders can consider entering a trade in the direction of the reversal (buying during an uptrend or selling during a downtrend).
2. Confirmation of Trend Continuation
If the price reaches a Fibonacci level but doesn’t reverse, it may indicate that the current trend is likely to continue.
For instance, if the price hits the 23.6% retracement level and continues moving in the direction of the trend, this suggests the trend is still strong.
3. Combine with Other Indicators
To improve the accuracy of your trading decisions, combine the Fibo Average Indicator with other technical indicators like RSI, MACD, or Moving Averages.
For example, if the price approaches the 50% Fibonacci retracement level and the RSI indicates that the market is oversold, it could be a strong signal to go long.
Advantages of the Fibo Average Indicator MT4
There are several reasons why the Fibo Average Indicator is popular among Forex traders:
Clear Visuals: The Fibonacci levels are plotted directly on the chart, allowing for easy identification of support and resistance zones.
Flexible and Customizable: The indicator allows you to customize the Fibonacci levels to fit your strategy.
Predictive Power: Fibonacci retracement levels are proven to work in various markets, making them useful for both short-term and long-term traders.
Simple to Use: The indicator is easy to install and use, making it a great choice for traders of all levels.
Free to Use: As a free indicator for MT4, the Fibo Average Indicator provides great value to traders without additional costs.
How to Set Up the Fibo Average Indicator on MT4
Setting up the Fibo Average Indicator on your MT4 platform is simple:
Download the Indicator: First, download the Fibo Average Indicator from a trusted source like IndicatorForest.com.
Install the Indicator: Place the indicator file in your MT4 'Indicators' folder.
Apply to Chart: Open the chart for the currency pair you want to trade, then apply the indicator. You'll see the Fibonacci levels appear on the chart automatically.
Best Practices for Trading with the Fibo Average Indicator
While the Fibo Average Indicator is a valuable tool, it’s essential to use it correctly to maximize its effectiveness:
Combine with Price Action: Always consider the price action and candlestick patterns around the Fibonacci levels for better entry and exit timing.
Use Multiple Timeframes: Check higher timeframes for broader trend context. A level that aligns with a trend on a higher timeframe is more significant.
Set Stop Losses and Take Profits: Always use proper risk management. Set stop-loss orders just beyond the Fibonacci levels and take profit at the next key level.
By following these best practices, you can improve the accuracy and profitability of your trades using the Fibo Average Indicator.
Conclusion
The Fibo Average Indicator MT4 is a powerful tool that helps Forex traders identify potential entry and exit points by plotting Fibonacci retracement levels. It provides valuable insights into key support and resistance zones, enabling traders to make more informed decisions. Whether you're a beginner or a seasoned pro, this free and easy-to-use indicator is a must-have in your Forex trading toolkit.
For more free MT4 indicators and trading resources, visit IndicatorForest.com and start optimizing your Forex trading strategy today.
FAQ
Fibo Average combines Fibonacci retracement levels with moving average analysis. It uses Fibonacci ratios to determine moving average periods and identifies key support/resistance levels based on Fibonacci mathematics.
By using Fibonacci ratios for MA periods, the indicator identifies levels that align with natural market rhythms. This combination provides support/resistance levels that often act as significant price reaction zones.
Enter trades when price approaches Fibo Average levels, trade bounces off Fibonacci-based support/resistance, use Fibo Average for stop-loss placement, and combine with trend direction for better results.
The combination provides mathematically-based support/resistance levels, identifies levels that align with market psychology, offers both trend and level analysis, and creates stronger trading zones.
Combine with trend indicators for direction, use with momentum oscillators for confirmation, integrate with price action patterns, and combine with volume analysis to validate Fibo Average reactions.
Published:
Dec 17, 2025 02:10 AM
Category: