Understanding Trend Momentum with the Fibo Bars Indicator
In the world of Forex trading, identifying the underlying momentum of a trend is often the difference between a profitable trade and a false breakout. While traditional indicators like the Relative Strength Index (RSI) or Moving Averages are widely used, many traders find them too slow to react to rapid market changes. The Fibo Bars indicator offers a unique alternative, utilizing Fibonacci-based mathematical principles to visualize market sentiment directly in a sub-window, helping traders pinpoint the exact moments when momentum shifts.
The Logic Behind Fibo Bars
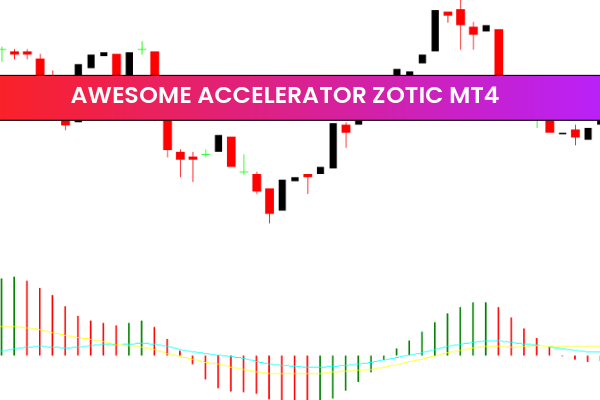
The Fibo Bars indicator does not simply plot price; it analyzes the internal "pulse" of the market. By applying Fibonacci ratios to volume and Price Action, it identifies zones where momentum is accelerating or decelerating. This data is then presented as a clean, easy-to-read bar system beneath your main chart.
- Color-Coded Momentum: The indicator uses distinct colors to represent different stages of market momentum. For instance, a specific color might denote strong buying conviction, while another highlights periods of exhaustion or potential reversals.
- Trend Filtering: By watching how these bars interact with the zero-line or shift color, traders can filter out "noise"—those erratic price movements that often trap inexperienced traders into poor positions.
Applying Fibo Bars on Lower Timeframes
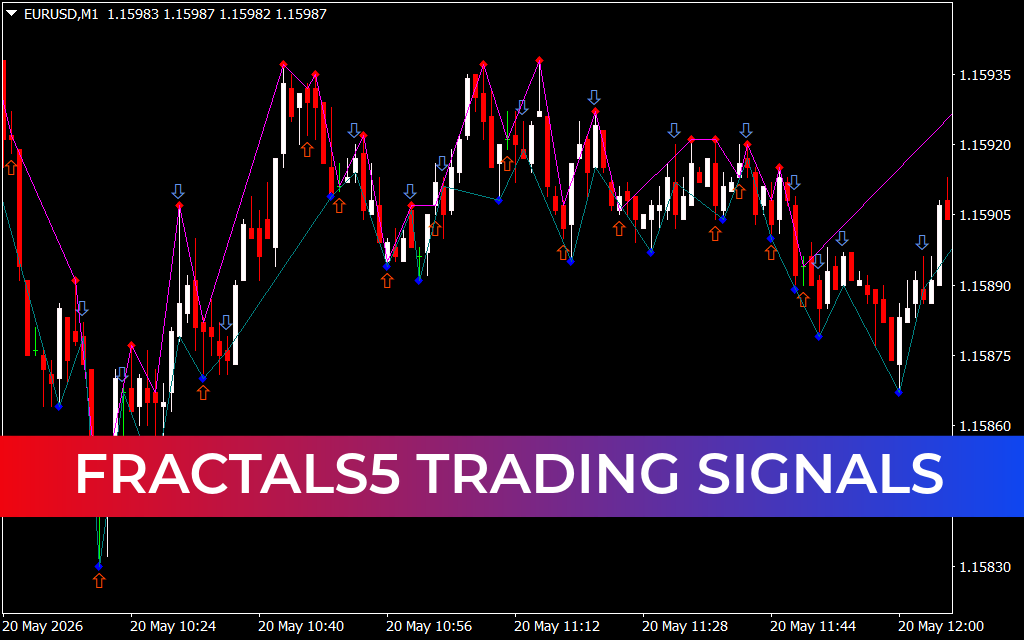
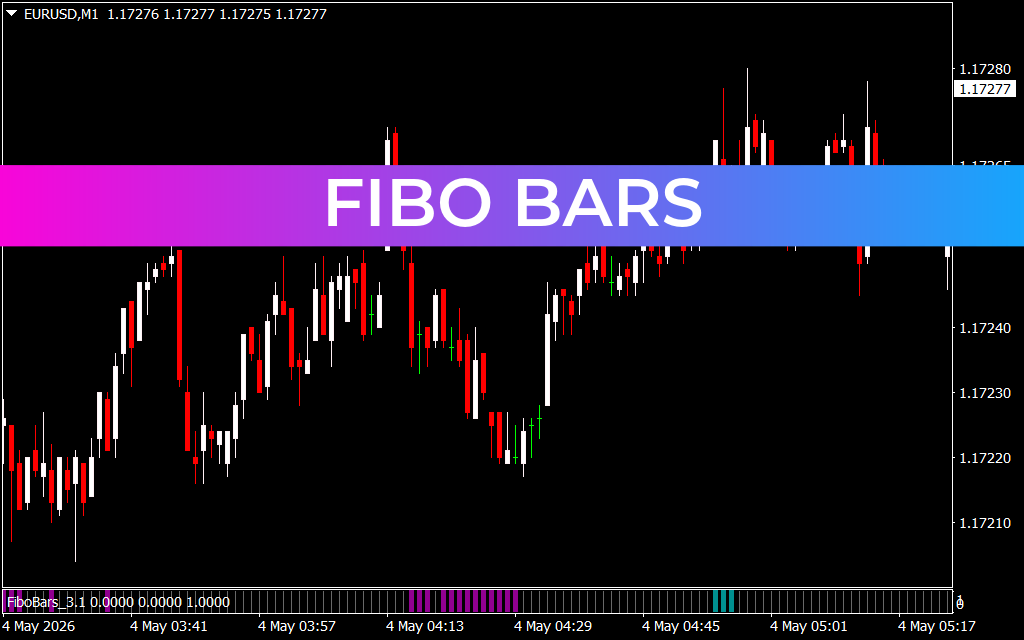
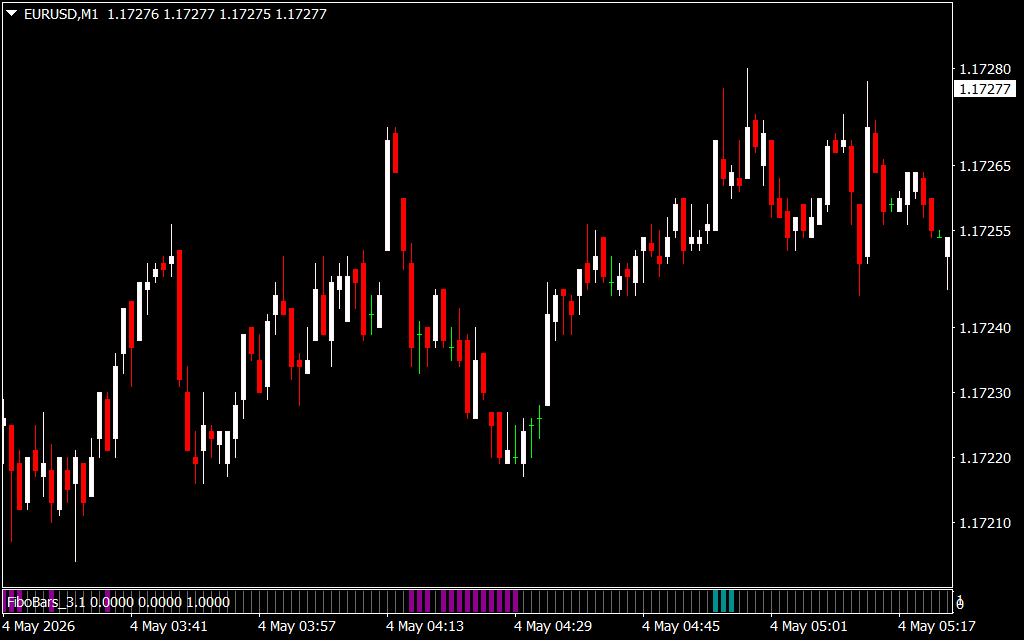
As shown in the EURUSD M1 chart, Fibo Bars are exceptionally powerful for scalpers and day traders. On a 1-minute chart, volatility is high, and price can change direction in an instant. Fibo Bars help you cut through this noise by providing a smoothed, objective look at the current momentum.
Notice how the indicator stays consistent during the dominant trend, providing a clear visual confirmation of the direction. When the color shifts or the bars shrink, it often acts as a "warning light" that the current impulse move is losing steam, allowing traders to exit with profit before the market retraces. This level of clarity is vital when executing trades where every second counts.
Strategic Integration for Success
The Fibo Bars indicator is most effective when used as a confirmation tool within a broader trading strategy:
- Entry Trigger: Use the Fibo Bars as a final "go/no-go" signal. If your primary strategy suggests a buy, but the Fibo Bars are still showing bearish or neutral colors, it may be best to wait for a stronger signal.
- Trade Management: Keep the indicator visible while in a trade. If you are long and the Fibo Bars signal a shift in momentum, it serves as an objective exit signal, removing the emotional urge to "hold and hope" for a recovery.
- Divergence Signals: Like other oscillators, watch for divergences. If price makes a new high but the Fibo Bars fail to show matching momentum, it is a classic warning sign of a pending Trend Reversal.
By providing a clear, math-driven view of market momentum, the Fibo Bars indicator removes the subjectivity from your technical analysis. It ensures that your entries and exits are based on the actual pulse of the market, helping you maintain the discipline required for long-term consistency in the Forex market.
2 Downloads
Last Update:
May 04, 2026 10:28 AM
Published:
Jan 28, 2026 17:23 PM
Category: