Master Market Geometry with the FIBO Lines V1 Indicator
In the complex ecosystem of financial markets, Price Action is rarely random. Instead, it often adheres to mathematical ratios that have been observed for centuries. Among the most powerful of these are Fibonacci retracement and expansion levels. The FIBO Lines V1 indicator is a premier automated tool designed to plot these critical horizontal levels on your charts, providing traders with a roadmap of potential support, resistance, and Trend Reversal zones without the need for manual calculation.
The Power of Automated Fibonacci Analysis
Most traders are familiar with the standard Fibonacci tool, which requires manually selecting a significant "Swing High" and "Swing Low." However, manual plotting is prone to human error and subjectivity—what one trader sees as a major pivot, another might ignore.
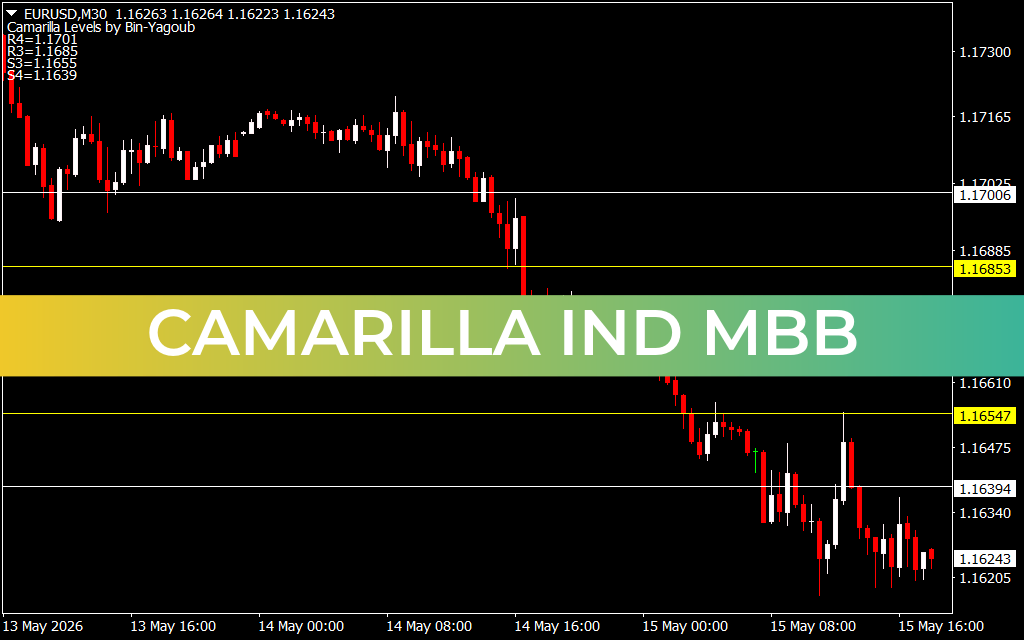
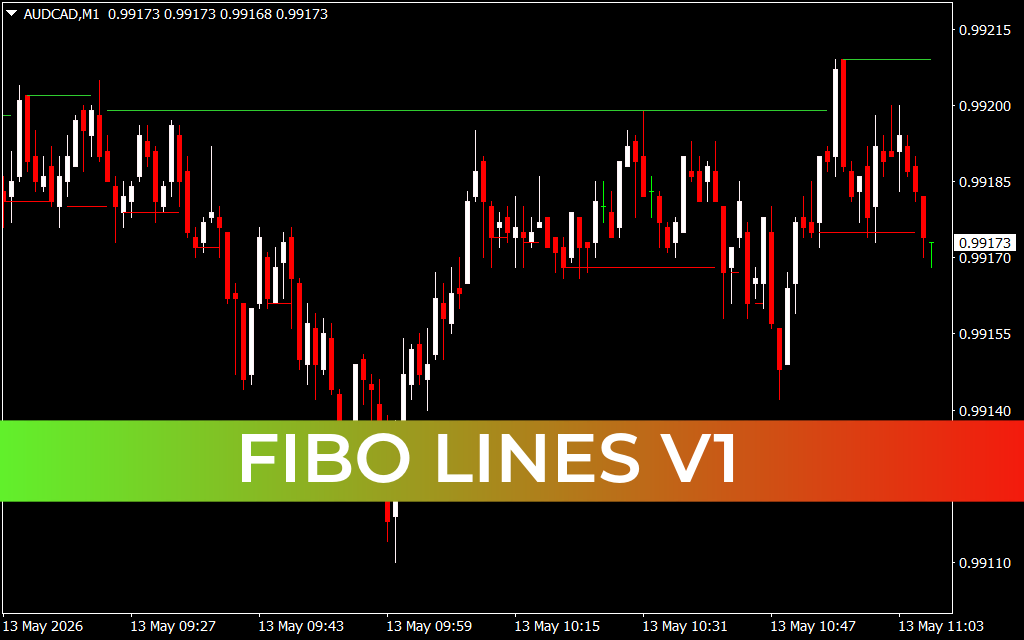
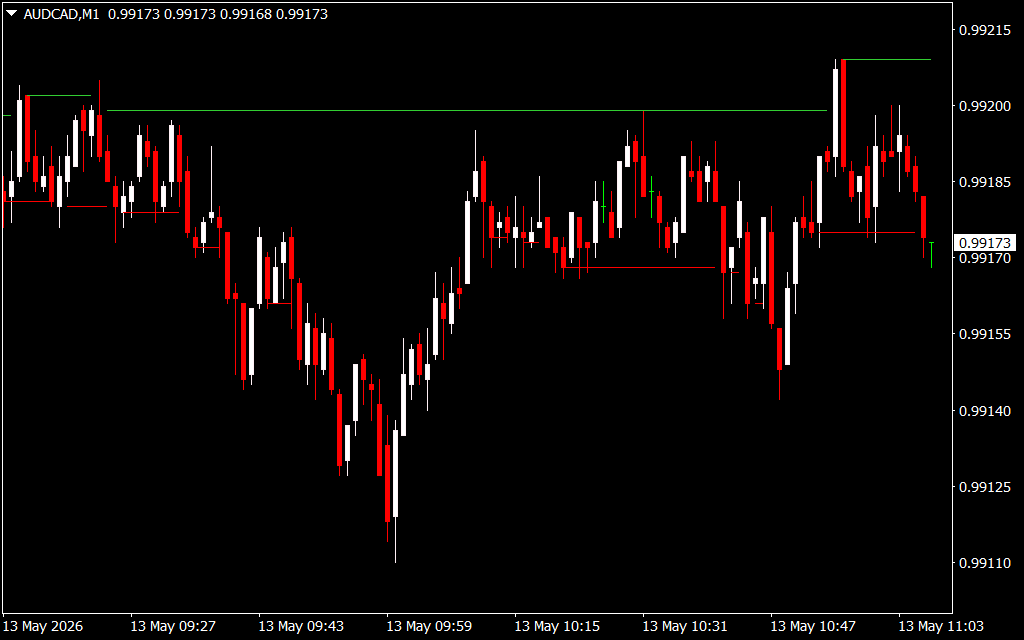
The FIBO Lines V1 eliminates this inconsistency. By utilizing advanced algorithms to detect Market Structure shifts, it automatically identifies the most relevant price peaks and troughs. As shown in the AUDCAD M1 chart, the indicator draws clean, horizontal lines that act as psychological barriers where price is likely to react. The red lines typically signify support levels where buying interest may emerge, while green lines represent resistance zones where sellers often take control.
Strategic Trading Advantages
- Precision Entries and Exits: FIBO Lines V1 identifies the "Golden Ratio" levels (such as 61.8%) where trends often exhaust themselves before resuming. Entering a trade at these pre-defined lines allows for tighter stop-losses and higher reward-to-risk ratios.
- Confluence Identification: The true strength of this indicator is revealed when it is used alongside other technical tools. In the provided EURUSD M15 example, a trader might look for a Corrected RSX momentum shift to occur exactly as price touches a FIBO Line. When an oscillator signal aligns with a structural Fibonacci level, the probability of a successful trade increases exponentially.
- Dynamic Support And Resistance: Unlike static pivot points, FIBO Lines V1 adapts to the current market volatility. On lower timeframes like the M1, it helps scalpers identify quick "bounce" opportunities, while on higher timeframes, it reveals major institutional Supply And Demand zones.
Enhancing Your Trading Discipline
One of the greatest challenges in trading is "chasing" the market. FIBO Lines V1 instills discipline by giving you a reason to wait. Instead of entering mid-range, the indicator encourages you to wait for price to interact with a specific level. This "wait-and-see" approach reduces overtrading and ensures you are only participating in high-conviction setups.
Whether you are a price action purist or a multi-indicator strategist, the FIBO Lines V1 is an essential upgrade for your MetaTrader platform. It strips away the guesswork and provides a clear, mathematical framework for understanding market direction.
Conclusion
FIBO Lines V1 is more than just a drawing tool; it is a lens through which you can view the hidden mathematical order of the markets. By automating the identification of Fibonacci levels, it allows you to focus on what matters most: execution and risk management. Integrate FIBO Lines V1 into your workstation today and start trading with the precision of market geometry
2 Downloads
Last Update:
May 13, 2026 14:08 PM
Published:
Jan 23, 2026 01:34 AM
Category: