Trade High-Probability Breakouts with the Flag Pennant Pattern Indicator
In classical chart analysis, continuation patterns are among the most reliable setups for capturing large, institutional market trends. When a market enters a strong directional phase, it rarely moves in a straight line; instead, it takes brief pauses to consolidate before resuming its primary trajectory. The Flag Pennant Pattern indicator automates the complex visual task of identifying these key consolidation phases, giving traders a definitive edge in spotting explosive breakout setups.
Here is an in-depth breakdown of how this automated pattern recognition tool works and how to implement it successfully on platforms like MetaTrader.
What is the Flag Pennant Pattern Indicator?
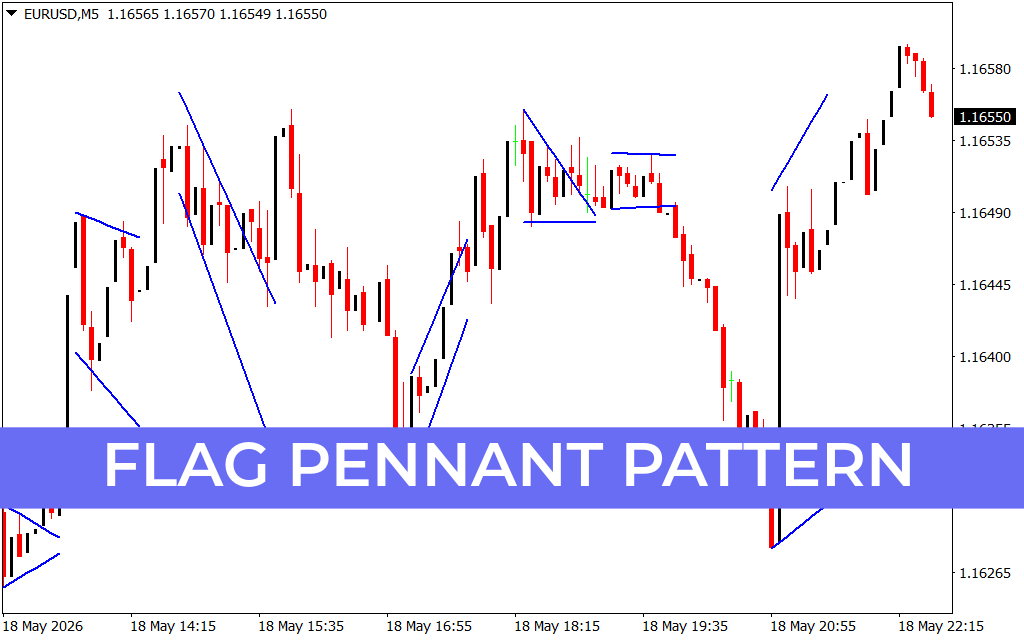
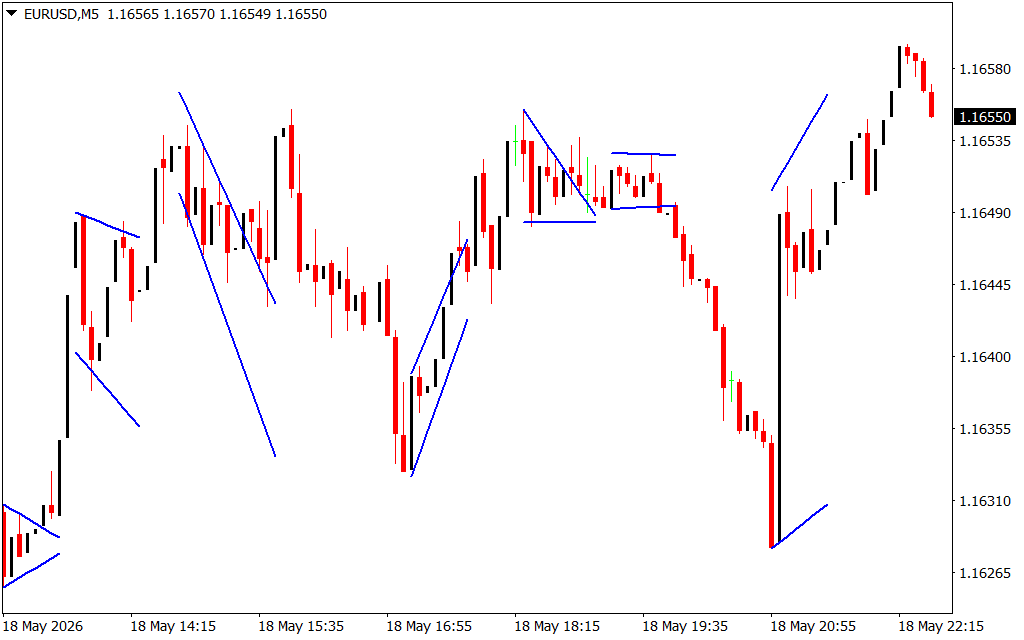
The Flag Pennant Pattern indicator is an advanced chart overlay tool that scans Price Action in real time to locate structural consolidation configurations. Instead of requiring you to manually draw trendlines across every minor high and low, the indicator automatically plots precise blue bounding lines around localized price structures.
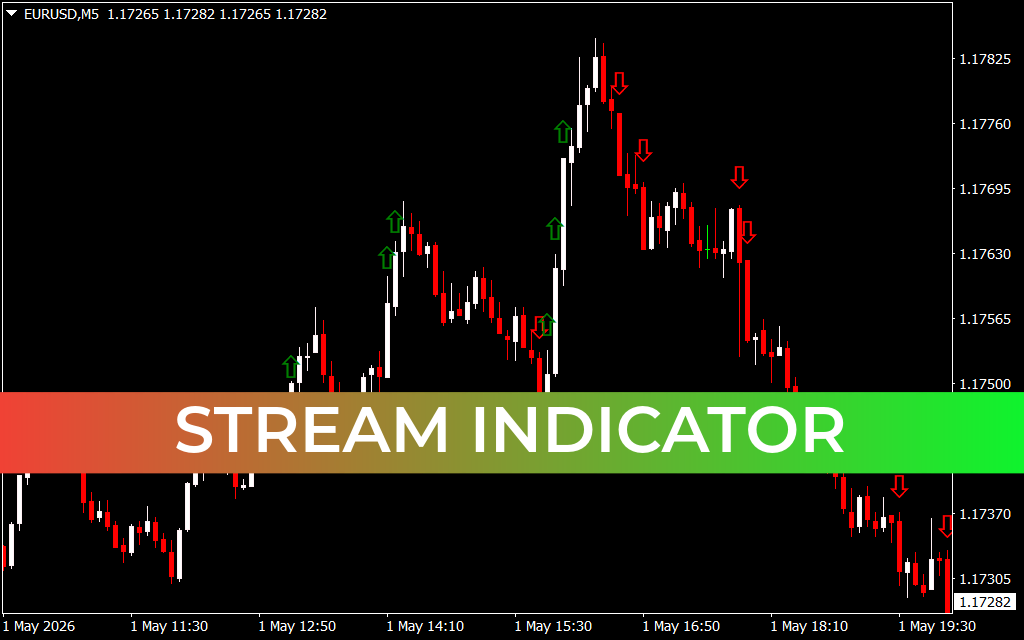
As displayed on the EURUSD M5 chart, the indicator isolates two primary structural setups:
- Flags: Marked by parallel blue trendlines that slope gently against the prevailing impulse move (forming bullish or bearish flag channels).
- Pennants: Formed by converging blue trendlines that mimic a miniature symmetrical triangle, highlighting a rapid compression of market volatility.
Both patterns begin with a sharp, aggressive price expansion—known as the flagpole—followed by a tighter consolidation matrix. When price breaks out beyond the blue boundary lines, it signals that the broader market is ready to resume its original trend.
Strategic Advantages for Technical Analysts
- Fully Automated Pattern Scanning: It eliminates the subjectivity of manual chart drawing, standardizing your pattern recognition rules across multiple timeframes.
- Precise Volatility Tracking: The converging or parallel blue lines perfectly map the exact boundaries where market volume is compressing, preparing you for an imminent expansion phase.
- Objective Target Projection: Classic chart patterns offer mathematical target rules. The height of the preceding "flagpole" can be projected from the breakout point to establish highly accurate take-profit levels.
Practical Trading Implementations
To maximize your success with the Flag Pennant Pattern indicator, apply these two foundational breakout strategies:
- The Direct Boundary Breakout: Identify the prevailing direction of the market before the pattern formed. In a macro uptrend, wait for a candlestick to close cleanly above the upper blue resistance line of a flag or pennant. Enter a long market order at the close of the breakout candle, placing your stop-loss just below the opposite boundary line.
- The Multi-Timeframe Trend Filter: For a higher win rate, use this indicator on lower timeframes (like the M5 or M15 charts) exclusively in the direction of the higher-timeframe trend (such as the H1 or H4 charts). If the macro trend is strongly bullish, ignore bearish breakdown flags entirely and focus solely on trading upside triggers.
6 Downloads
Last Update:
May 19, 2026 01:41 AM
Published:
Jan 19, 2026 20:49 PM
Category: