Precision Trading with the Fractal Support and Resistance Indicator
Finding reliable entry and exit points is the cornerstone of a successful trading strategy. While standard Support And Resistance levels are useful, they often lack the mathematical precision required for high-frequency or multi-timeframe trading. The Fractal Support and Resistance indicator for MetaTrader is designed to bridge this gap, utilizing Bill Williams' fractal theory to identify "true" market turning points with surgical accuracy.
The Science of Fractals in Forex
At its core, a fractal is a geometric shape that can be split into parts, each of which is a reduced-size copy of the whole. In the financial markets, this translates to recurring price patterns that appear across all timeframes. A standard fractal consists of five consecutive bars, where the middle bar has the highest high (a bearish fractal) or the lowest low (a bullish fractal) of the group.
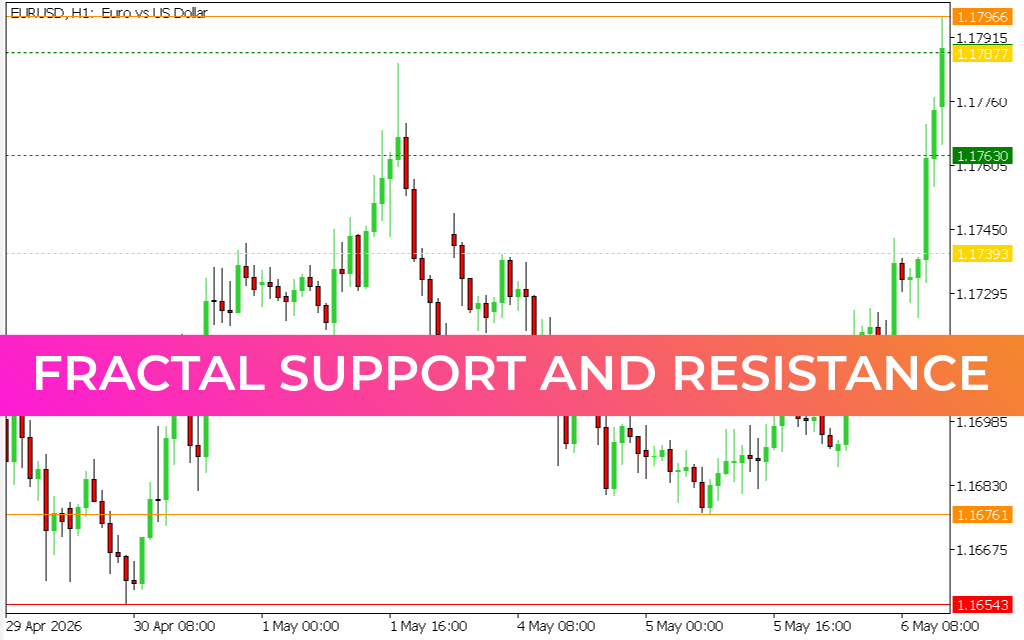
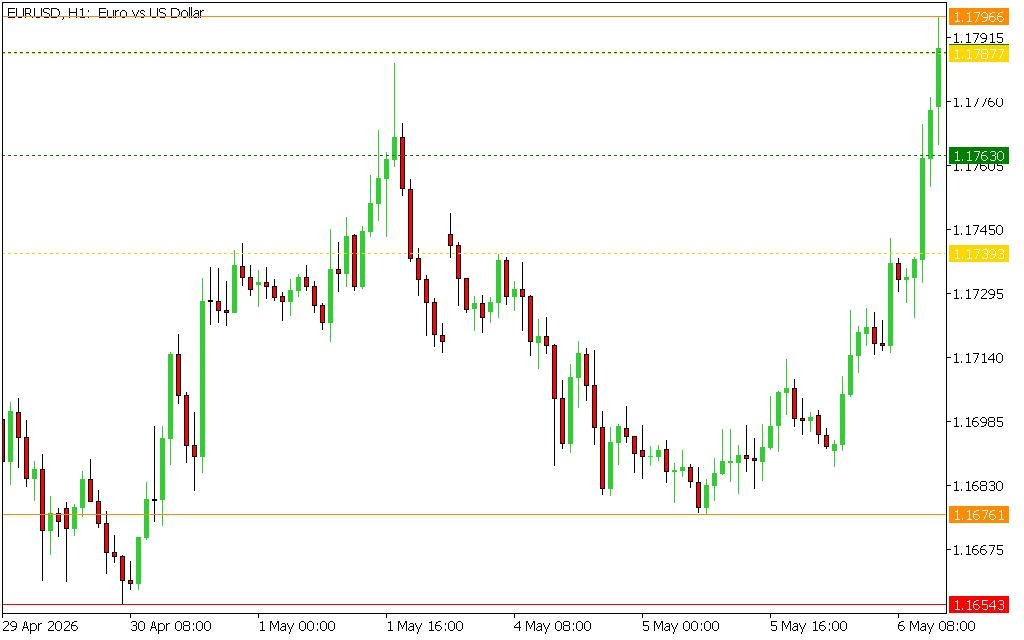
The Fractal Support and Resistance indicator takes these individual points and projects them horizontally across the chart. As seen in the EUR/USD H1 chart, these levels create a clear "ladder" of price ceilings and floors. By connecting these significant peaks and troughs, the indicator filters out market noise and highlights the levels where institutional Supply And Demand are actually shifting.
Strategic Visuals and Key Features
This indicator stands out by providing a clean, color-coded interface that simplifies complex market structures:
- Multi-Level Projection: Unlike basic fractal arrows that only mark a single candle, this tool draws sustained horizontal lines (green, yellow, orange, and red) to show how long a specific level has been respected by the market.
- Dynamic Range Identification: The indicator automatically adjusts to the volatility of the current timeframe. On the H1 chart shown, it identifies key zones like 1.17393 and 1.17630, which serve as critical magnets for Price Action.
- Breakout and Rejection Signals: When price approaches a fractal line, traders can look for two specific behaviors. A "rejection" (wick touching the line) suggests a reversal, while a "candle body close" above or below a line signals a high-probability breakout.
Why Every Technical Trader Needs This Tool
The primary challenge with manual support and resistance is subjectivity—two traders might draw different lines on the same chart. The Fractal Support And Resistance Indicator removes this human bias. Because it is based on a fixed mathematical formula (the 5-bar fractal), the levels it generates are objective and consistent.
Furthermore, these levels are incredibly effective for setting Stop Loss and Take Profit orders. Placing a stop just beyond a projected fractal line ensures that your trade is protected by a proven structural barrier. For trend followers, these lines act as a roadmap for trailing stops, allowing you to lock in profits as the market moves from one fractal level to the next.
Whether you are Scalping the M5 or swing trading the Daily chart, the Fractal Support and Resistance indicator provides the structural clarity needed to navigate the markets with confidence.
12 Downloads
Last Update:
May 11, 2026 21:16 PM
Published:
Jan 24, 2026 13:41 PM
Category: