Master Market Turning Points with the Fractals Signal Diapazon Indicator
In the complex landscape of technical analysis, identifying the exact moment a trend exhausts itself is the "Holy Grail" for many traders. The Fractals Signal Diapazon Indicator is a high-performance technical tool designed to pinpoint these critical reversal zones with surgical precision. By leveraging the mathematical principles of fractals, this indicator helps traders navigate Price Action and capitalize on market swings before they become obvious to the masses.
Understanding the Power of Fractals
Fractals are recurring patterns that appear within larger, more chaotic price movements. In trading, a fractal signal typically identifies a high or low point where the price has failed to push further, suggesting a change in direction. The Fractals Signal Diapazon Indicator takes this classic concept to the next level. Instead of just marking a single point, it analyzes the "diapazon"—or range—of these signals to provide a more comprehensive view of Support And Resistance levels.
Key Features of Fractals Signal Diapazon
This indicator is built for traders who demand clarity and efficiency. Its primary features include:
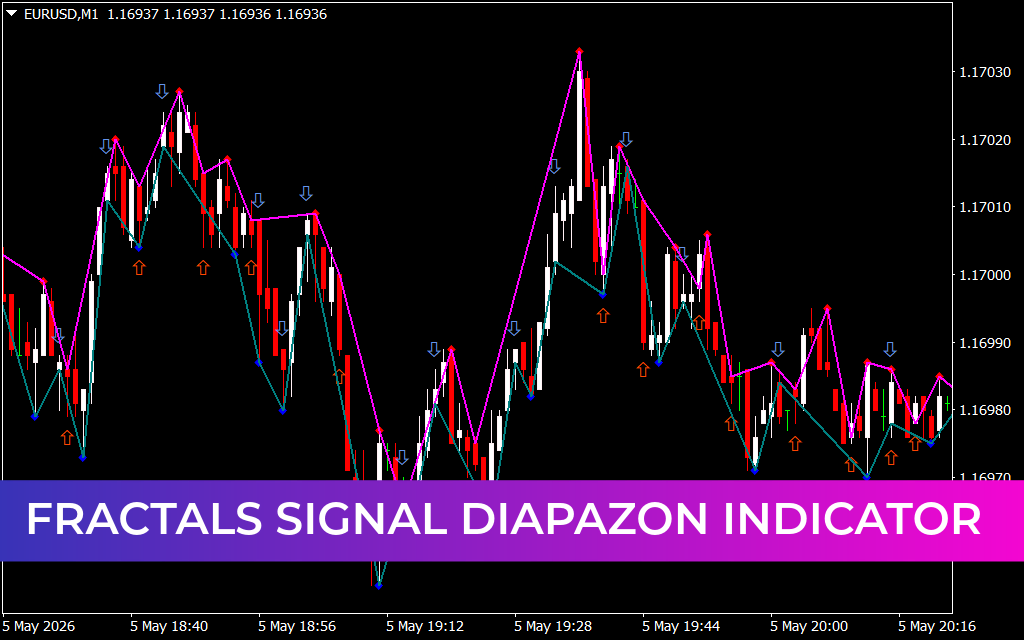
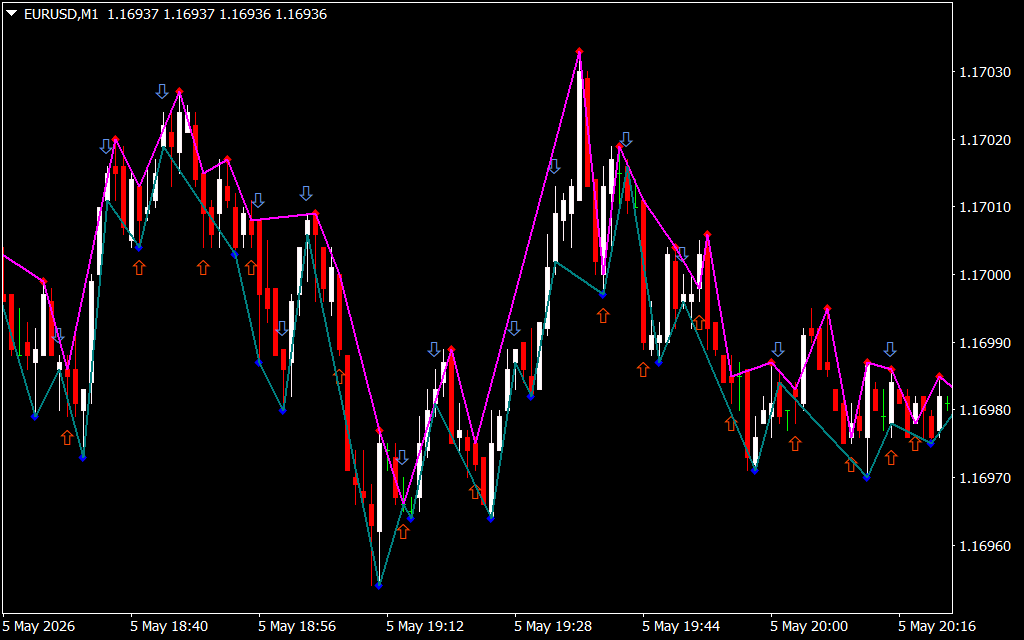
- Dynamic Reversal Arrows: The indicator plots clear visual cues (arrows) on the chart to signify potential buy and sell opportunities.
- Range Analysis (Diapazon): By connecting fractal points with dynamic lines, the indicator visualizes the current price channel or "diapazon," helping you see the boundaries within which the market is currently breathing.
- Multi-Timeframe Reliability: Whether you are a scalper looking at the 1-minute chart or a swing trader on the daily timeframe, the fractal logic remains mathematically sound across all periods.
- Noise Reduction: Traditional fractal indicators can be "noisy," providing too many signals. The Diapazon version filters these movements to focus on the most significant structural shifts in price.
How to Trade with Fractals Signal Diapazon
The most effective way to use this indicator is to look for "confluence." When the price reaches the upper boundary of the diapazon and a bearish fractal signal appears, it creates a high-probability short entry. Conversely, when the price hits the lower boundary and a bullish arrow appears, it signals a strong buying opportunity.
Because fractals highlight structural highs and lows, this indicator is also an exceptional tool for placing stop-loss orders. By placing your stop just beyond the most recent fractal point, you are using the market's own structural geometry to protect your capital.
Conclusion
The Fractals Signal Diapazon Indicator is more than just a signal generator; it is a roadmap of market structure. By helping you visualize the natural ebb and flow of price action through the lens of fractal geometry, it removes the guesswork from trend analysis. If you are looking to refine your entries and better understand market ranges, this tool is an essential addition to your trading platform.
SEO Meta Descriptione.
5 Downloads
Last Update:
May 06, 2026 01:34 AM
Published:
Jan 27, 2026 13:19 PM
Category: