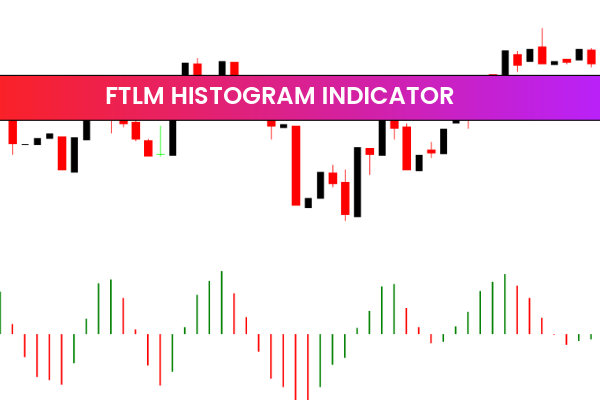
The FTLM Histogram Indicator is a popular and free Forex Indicator for the MT4 trading platform. It is designed to help traders identify potential turning points in the market, giving them the ability to make more informed decisions and potentially increase profits.
By visually comparing the closing price of a currency pair to its recent highs and lows, the indicator provides a clear representation of market momentum and Trend Strength. Its intuitive histogram display makes it easy to spot potential trend reversals and market turning points.
What Is the FTLM Histogram Indicator?
The FTLM Histogram Indicator works by analyzing Price Action over a set period. Key features include:
Compares the current closing price to the highest and lowest prices of a defined period
Displays the results as a histogram on the MT4 chart
Highlights high and low points in different colors for easy interpretation
This visual representation allows traders to quickly assess market conditions and anticipate trend reversals.
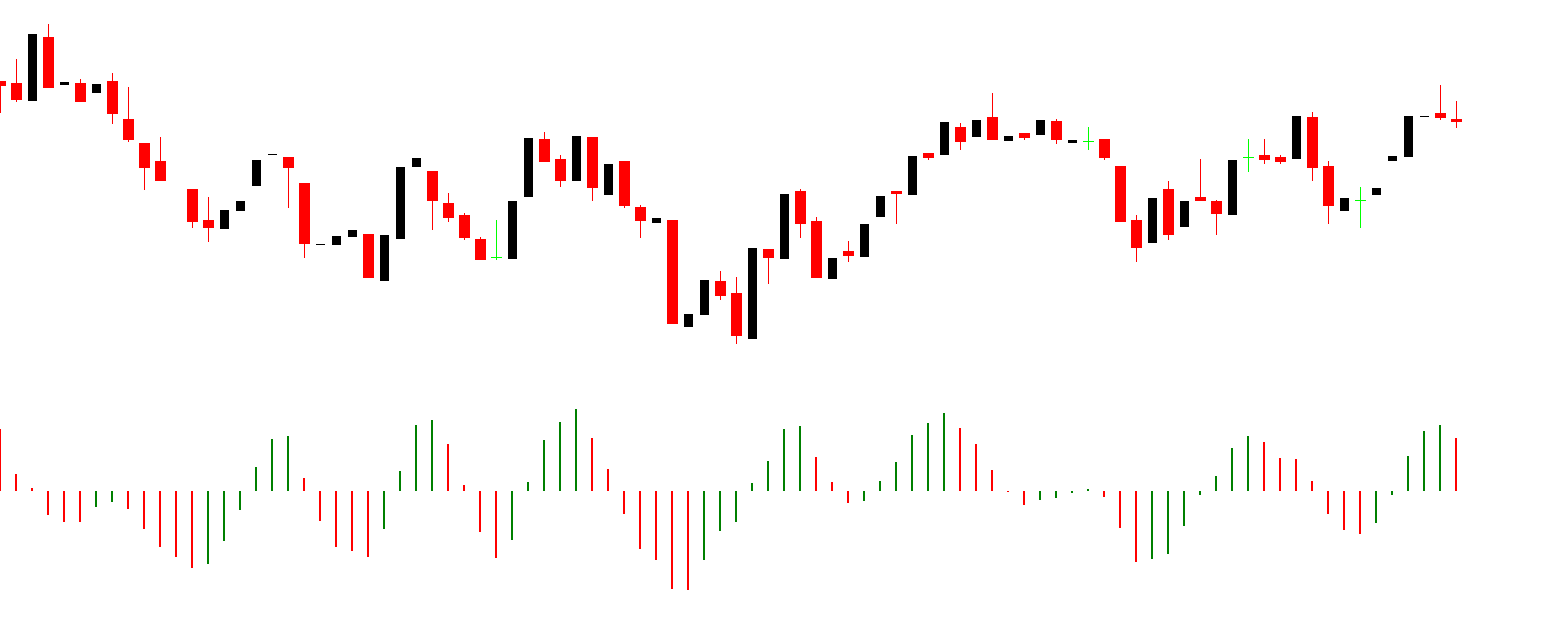
How the Indicator Works
The indicator’s histogram bars provide insight into potential trend changes:
High histogram bars indicate that the price is reaching a peak and a potential reversal may occur
Low histogram bars suggest that the price is at a trough, signaling a possible upward move
Color-coded highs and lows make it easy to identify key turning points without complex calculations
By analyzing the histogram, traders can determine the strength of the current trend and prepare for possible reversals.
Identifying Potential Turning Points
The FTLM Histogram is particularly useful for detecting market turning points:
Buy opportunities: When the histogram shows low values at a support level, suggesting an upward reversal
Sell opportunities: When the histogram shows high values at a resistance level, suggesting a downward reversal
Trend confirmation: Histogram trends can be combined with other indicators like moving averages or RSI for better accuracy
This approach allows traders to time their entries and exits more effectively.
Benefits of Using the FTLM Histogram Indicator
The FTLM Histogram offers several advantages:
Free and easy to install on MT4
Provides a clear visual display of market highs and lows
Helps identify trend reversals and turning points signal
Supports multiple timeframes for short-term and long-term trading
Color-coded histogram makes interpretation simple and quick
Its ease of use and clarity make it a favorite among MT4 traders.
Best Practices for Trading with the FTLM Histogram Indicator
To maximize the effectiveness of the indicator:
Combine histogram signals with trend indicators such as MA or MACD for confirmation
Adjust the time frame to match your trading style (e.g., intraday, swing trading)
Use the histogram in conjunction with Support And Resistance levels for higher probability trades
Apply risk management strategies to protect capital
Testing on a demo account before using in live trading is recommended.
Why Traders Use the FTLM Histogram Indicator on MT4
Traders use the FTLM Histogram because it simplifies trend analysis and helps identify potential market reversals visually. By providing clear, color-coded histogram signals, it allows traders to quickly spot turning points, improve timing, and potentially increase trading profits.
For more free MT4 indicators, professional Forex tools, and trading strategies, visit IndicatorForest.com to enhance your trading experience.
5 Downloads
Published:
Jan 04, 2026 07:16 AM
Category: