Master Intraday Key Levels with the FXI Pivots Indicator
Navigating the financial markets without a clear map of institutional Support And Resistance is a quick way to find yourself on the wrong side of a trade. While retail traders spend hours drawing arbitrary trend lines that price frequently ignores, floor traders and algorithmic funds rely on mathematical realities: Pivot Points.
The FXI Pivots indicator for MetaTrader platforms automates this essential groundwork. It calculates and plots institutional-grade price levels entirely on autopilot, giving day traders and scalpers an objective roadmap for every trading session.
What is the FXI Pivots Indicator?
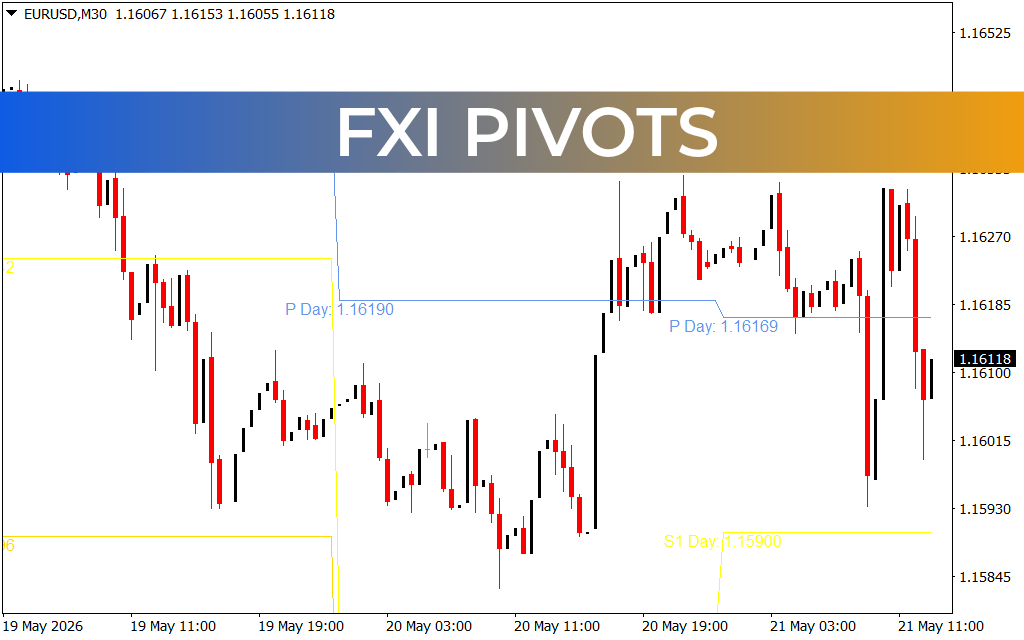
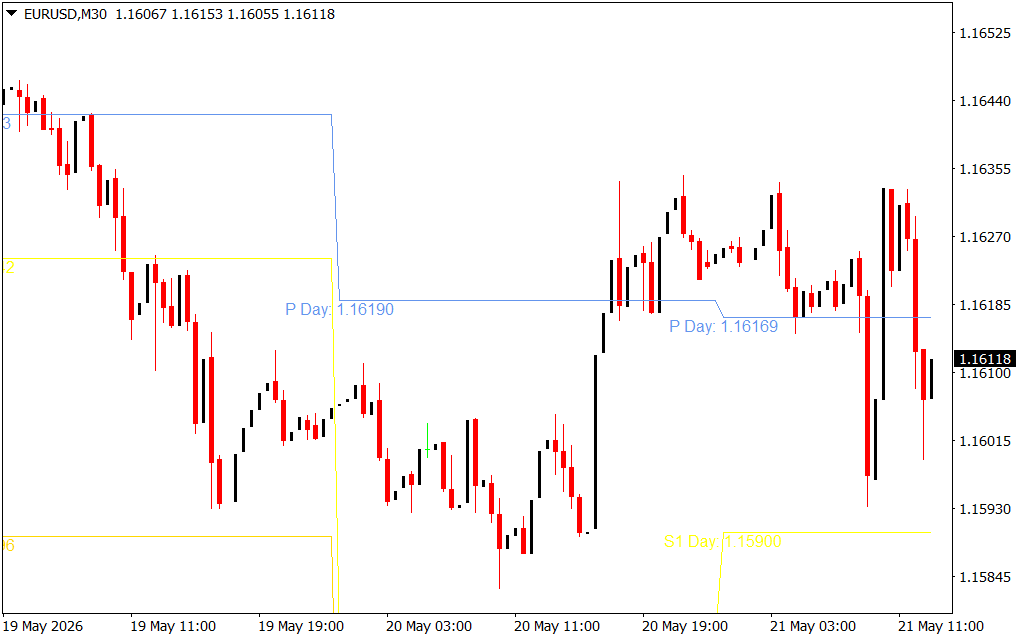
The FXI Pivots indicator is a premium technical charting tool designed to calculate and display daily, weekly, or monthly pivot levels directly on your trading screen. Derived from the high, low, and close prices of the preceding trading session, these lines represent pure mathematical equilibrium.
Because thousands of market participants look at the exact same point calculations simultaneously, these levels function as self-fulfilling prophecies. Instead of guessing where an asset might stall or reverse, the FXI Pivots indicator visually maps out the precise coordinates where institutional buying or selling pressure is mathematically scheduled to enter the market.
Key Features and Strategic Advantages
- Automated Level Generation: No manual plotting required. The indicator instantly calculates the primary Pivot Point (P), along with multiple Support (S) and Resistance (R) bands as soon as a new session opens.
- Historical Level Memory: View past pivot zones to identify institutional "hot spots" where heavy Price Action and volume accumulation have historically occurred.
- Clean Visual Interface: Uses crisp, color-coded horizontal baselines with clear text labels (e.g., P Day, S1 Day) so you can make split-second execution decisions without cluttering your screen.
- Adaptive Timeframe Integration: Perfectly optimized for lower timeframes like the M15 or M30 for rapid intraday Scalping, while remaining highly accurate for H1 and H4 swing trading setups.
How to Trade with FXI Pivots
Whether you prefer trading volatile breakouts or mean-reversion reversals, this tool provides the structural framework you need:
1. The Institutional Magnet (The Pivot Line)
The central Pivot Point (P) acts as the market’s anchor. If price opens or trades above the central pivot line, the intraday bias is fundamentally bullish. If it trades below, the bias is bearish.
2. Mean-Reversion Reversals
During quiet or range-bound market sessions, price will frequently ping-pong between the S1 and R1 bands. Smart traders watch for candlestick reversal patterns (like pin bars or engulfing candles) right at these calculated levels to catch rapid counter-trend bounces back toward the central pivot.
3. Breakout Acceleration
On high-impact news days, a clean, high-volume candle break through R1 or S1 signals an institutional breakout. Traders can comfortably enter in the direction of the breach, utilizing R2/R3 or S2/S3 as objective, math-based take-profit targets.
Conclusion
Successful trading relies on objectivity, not guesswork. By anchoring your strategy to the math-driven baselines of the FXI Pivots indicator, you realign your charting with the exact zones monitored by global banks and algorithms. Download the indicator today to pinpoint your entries and exits with institutional accuracy.
7 Downloads
Last Update:
May 21, 2026 16:26 PM
Published:
Jan 17, 2026 20:17 PM
Category: