Tracking Institutional Volatility: Trading Trend Cycles with the FXprime Indicator
In high-velocity financial markets, the core obstacle for retail day traders and swing operators is separating true structural expansions from manipulative market noise. Standard moving averages and oscillators often generate highly fragmented signals during choppy consolidation phases, leading to account drawdown and frustration. The FXprime Indicator for MT4/MT5 offers a sophisticated solution to this technical dilemma. By evaluating volume distribution and momentum shifts under a unified algorithmic matrix, this sub-window tool displays institutional trend dominance with absolute visual simplicity.
Deciphering the Trend Matrix on the EUR/USD H1 Chart
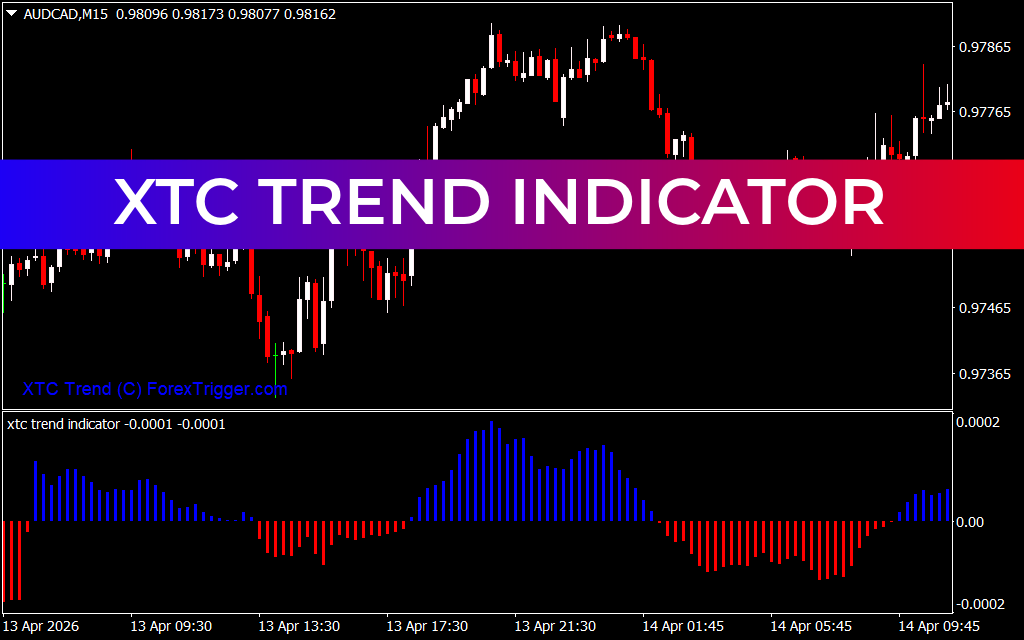
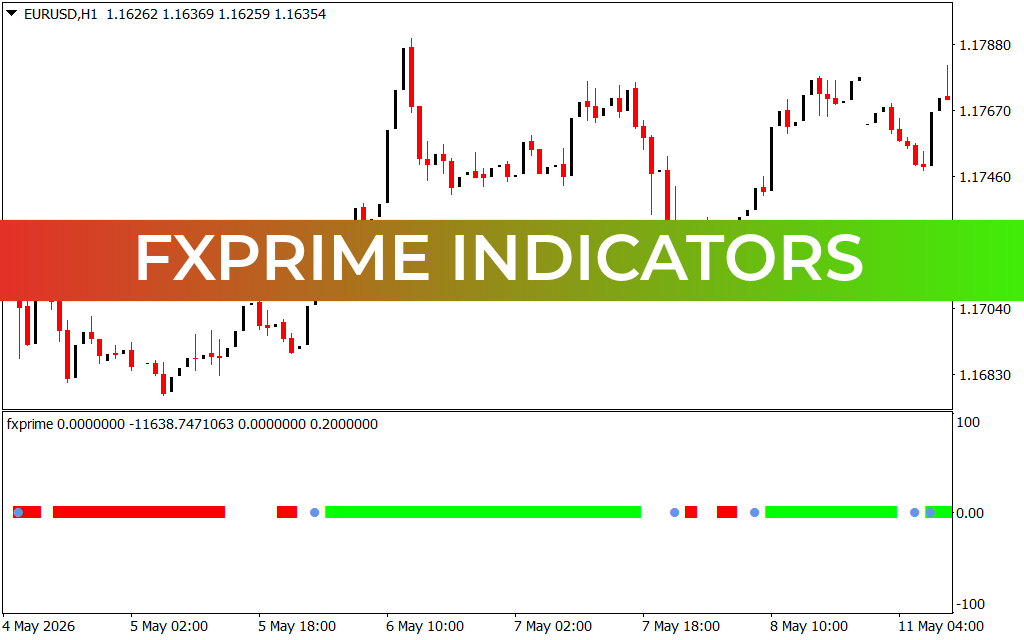
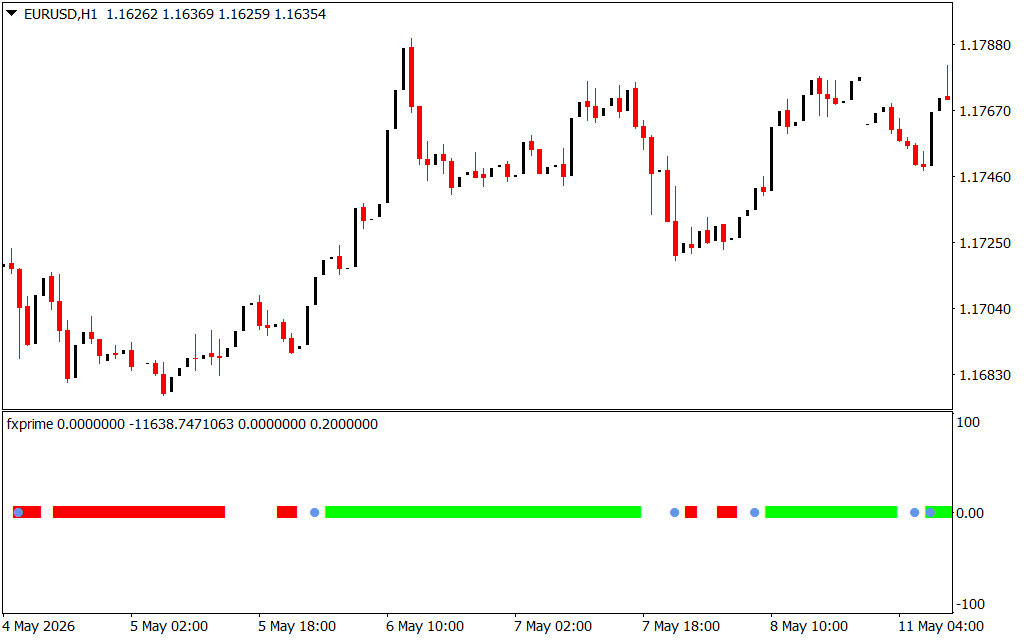
The provided EUR/USD 1-hour (H1) chart showcases the exceptional filtering power of the FXprime indicator across an extended multi-day trading session. Located in the bottom sub-window, the indicator translates complex mathematical equations into distinct, color-coded horizontal bars and structural dots that oscillate cleanly around a central 0.00 equilibrium baseline.
During the opening phase of the session, the currency pair engaged in a steep, systematic markdown, tumbling down from the 1.17815 liquidity pool. Notice how the FXprime indicator reacts to this institutional distribution: it prints a continuous, solid red horizontal block beneath the zero threshold line.
For trend followers, this clear visual signature acts as a strict directional filter. It warns traders that the bears maintain total dominance over the immediate order flow, ensuring that retail buyers avoid catching falling knives during a major downward expansion. The price steadily cascades through historical support barriers, hitting a macro cycle low near 1.16140 on May 15.
Spotting Trend Exhaustion and Structural Rotations
Beyond tracking active trend legs, the FXprime indicator excels at identifying structural exhaustion points well before they materialize clearly on the main price chart. As the EUR/USD pair approached the bottom of its markdown phase between May 15 and May 18, the aggressive selling momentum began to decelerate, signaling an accumulation phase.
Right at the absolute swing low, the FXprime indicator prints a distinct blue structural dot at the 0.00 baseline. In technical analysis, these specialized dot signatures denote a flash shift in equilibrium—warning traders that volume is drying up and a potential trend rotation is imminent.
Following this exhaustion dot, as the morning session of May 18 developed, a crisp green momentum bar printed on the right margin of the sub-window, perfectly aligning with a sharp, V-shaped price bounce back up toward the 1.16354 level. By utilizing the FXprime indicator in your daily workspace, you can safely ignore market noise, enter high-probability setups at the birth of a new trend, and trail your stop-losses with extreme structural precision.
3 Downloads
Last Update:
May 18, 2026 16:37 PM
Published:
Jan 20, 2026 12:51 PM
Category: