The Gann Signal Indicator for MT4 is built on the legendary trading concepts developed by W.D. Gann, a renowned stock and commodities trader. Gann’s techniques—especially Gann angles—are powerful tools that measure price, time, and Market Structure. Traditionally, drawing accurate Gann angles requires precision, experience, and manual effort, making it difficult for beginners and even time-consuming for advanced traders.
The Gann Signal Indicator simplifies this entire process by automatically plotting BUY and SELL signals using colored arrows. This gives traders the benefits of Gann’s methods without having to manually draw or calculate angles. Whether you trade intraday, swing, or long-term, this indicator provides clean, straightforward signals that fit into any trading strategy.
What Makes the Gann Signal Indicator Unique?
No Need to Draw Gann Angles
Gann angles involve specific mathematical relationships between price and time. Drawing them accurately in real time is tedious and confusing for many traders. This indicator eliminates that complexity by automating the entire system.
Simple Arrow-Based Signals
The indicator plots:
Green arrows → BUY signals
Red arrows → SELL signals
This straightforward display makes it easy for both beginners and advanced traders to take action immediately.
Works on All Timeframes
You can apply the Gann Signal Indicator for MT4 on any timeframe—from M1 Scalping charts to daily movement charts. It also works effortlessly across all forex pairs, commodities, and indices.
Customizable Settings
Traders can adjust parameters to fine-tune sensitivity, frequency of signals, and responsiveness to market volatility. This flexibility makes the indicator suitable for various trading styles.
How to Use the Gann Signal Indicator
Wait for the Signal Arrows
Trading with this indicator is incredibly simple. Just wait for the arrows to appear:
Green arrow: Open a BUY trade
Red arrow: Open a SELL trade
These arrows represent ideal trade setups derived from Gann angle dynamics.
Use Trend Confirmation
Although the indicator produces reliable signals, it is crucial to trade in the direction of the trend.
In an uptrend, ignore red arrows (counter-trend signals).
In a downtrend, avoid green arrows.
Using higher timeframes (H1, H4, Daily) to determine trend direction enhances accuracy.
Recommended Additional Indicators
To improve reliability, combine Gann signals with:
Moving Averages
RSI
Trend Strength indicators
Support and resistance zones
This ensures you filter out weaker signals and focus only on high-probability trade setups.
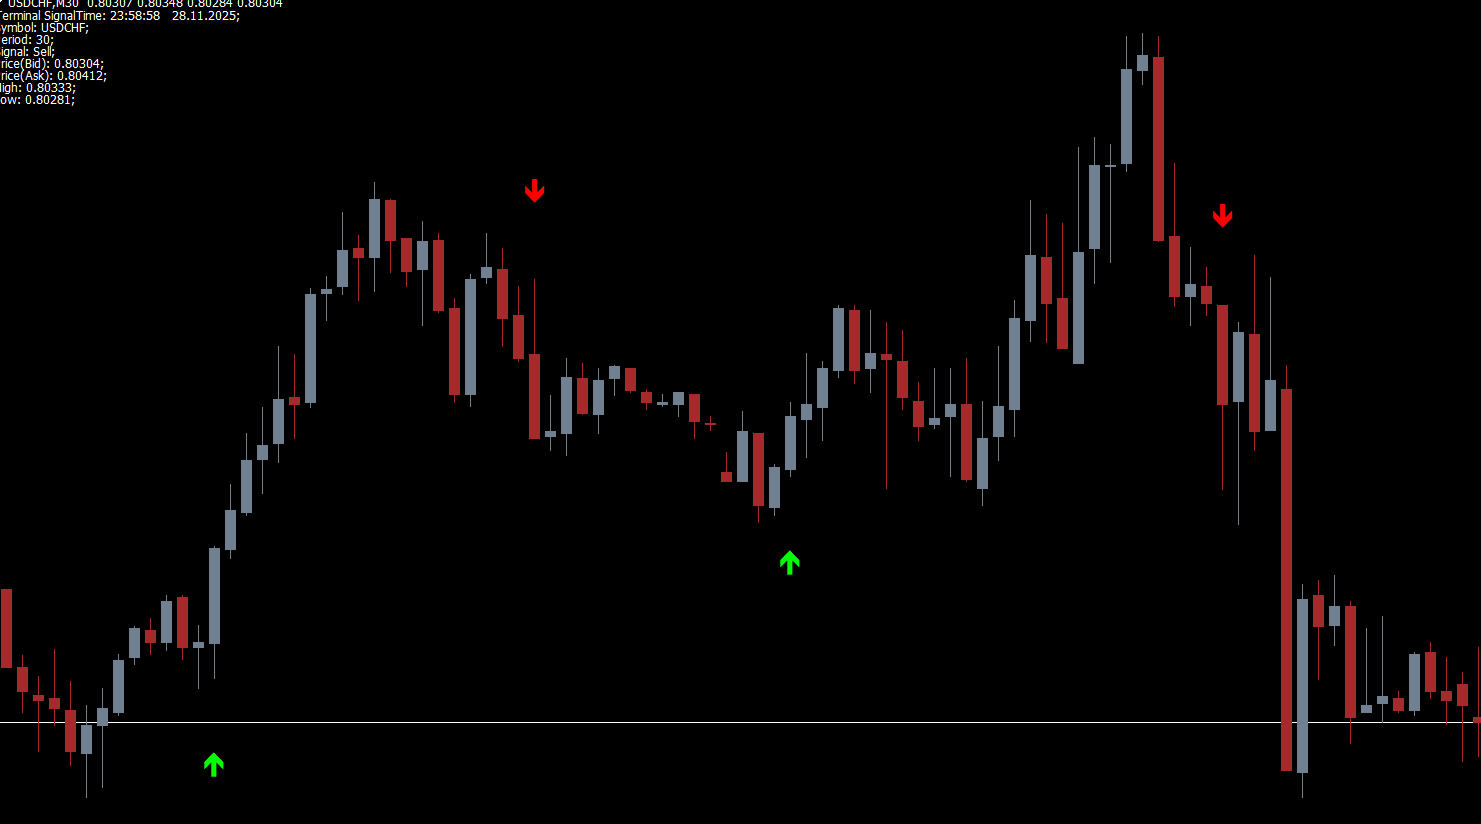
Chart Example Explained
In the example of the GBP/CHF chart:
The indicator produced two strong SELL arrows, both forming at a major resistance zone. Shortly after each arrow appeared, price dropped sharply, giving profitable short trades.
A green BUY arrow appeared once the market transitioned into a trending environment. Entering at this point would have resulted in an excellent long position as the price surged upward.
This example highlights why the indicator works best when paired with trend confirmation and market structure awareness.
FAQ
31 Downloads
Published:
Nov 29, 2025 09:28 AM
Category: