The Gann SSL Indicator for MT4 is inspired by the legendary trader William Gann, whose trading methods revolutionized market analysis. Gann’s techniques are based on dividing Price Action into bullish and bearish impulses — allowing traders to ride strong trends while avoiding noise.
This indicator automates that process by plotting a dynamic line that moves along with price action, clearly identifying market direction. Whether you trade forex, crypto, or stocks, the Gann SSL Indicator is a simple yet effective tool to align with the market trend.
How Does the Gann SSL Indicator Work?
The logic behind the Gann SSL Indicator is simple and powerful:
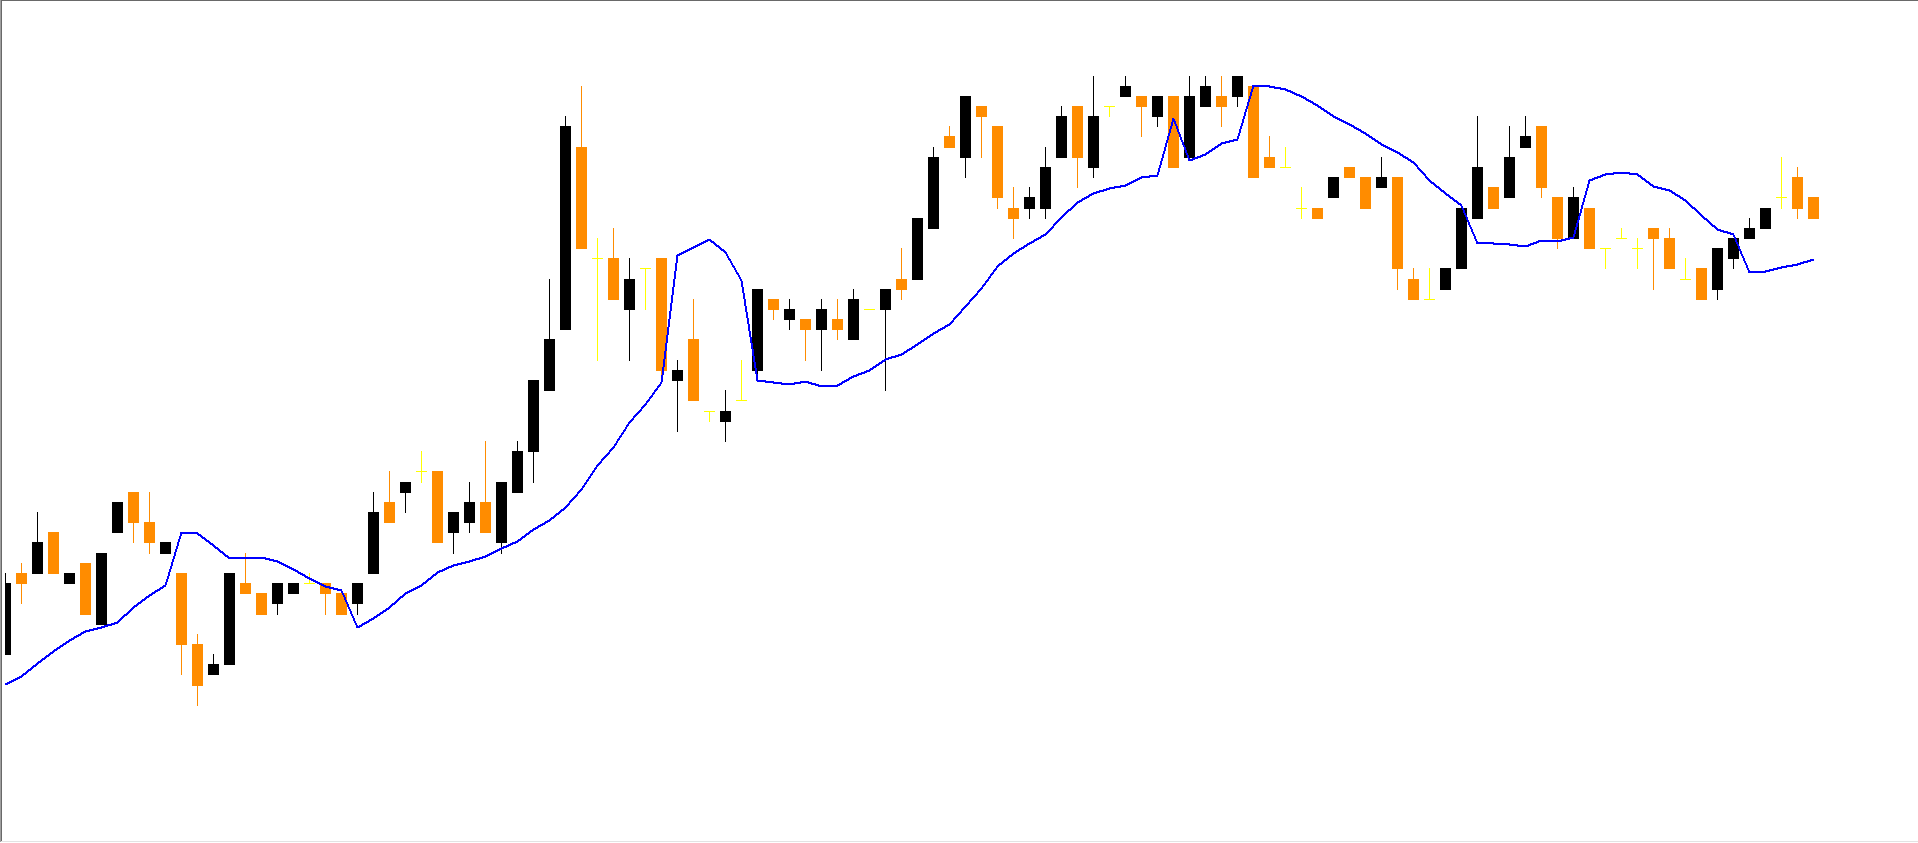
When price is above the indicator line → Bullish trend
When price is below the indicator line → Bearish trend
This visual representation helps traders quickly identify the market bias and act accordingly without complex chart analysis.
How to Trade Using the Gann SSL Indicator
Buy Signal Example (Bullish Setup)
The USD/JPY M30 chart below demonstrates a perfect example of a bullish entry:
Buy Conditions:
The previous candle closes below the indicator line.
The current candle closes above the indicator line.
Once both conditions are met, you can open a BUY position.
Set your Stop Loss below the previous local low and manage the trade using a trailing stop or exit on an opposite signal.
Sell Signal Example (Bearish Setup)
The EUR/USD M30 chart shows how the Gann SSL Indicator performs during a downtrend.
Sell Conditions:
The previous candle closes above the indicator line.
The current candle closes below the indicator line.
Open a SELL trade, placing a Stop Loss above the last swing high.
You can close your position when an opposite crossover appears or using your preferred exit method.
Advantages of the Gann SSL Indicator
Simple and beginner-friendly
Works for forex, crypto, and stocks
Does not repaint
Customizable sensitivity settings
Combines well with support/resistance indicators
Ideal for daily and weekly charts
Disadvantages
No built-in alert system
Can generate false signals in sideways or low-volume markets
While the Gann SSL Indicator simplifies Gann’s theory, it’s best to understand the fundamentals of Gann analysis for maximum efficiency.
Best Practices
Always confirm signals with another indicator such as the RSI Divergence, MACD, or Volume Profile.
Avoid trading during choppy or ranging markets.
Test the indicator on a demo account before applying it to live trades.
Conclusion
The Gann SSL Indicator for MT4 transforms William Gann’s timeless trading principles into an easy-to-use digital tool. By identifying trend direction through price-line crossovers, it enables traders to catch major moves early while keeping risk controlled.
This indicator is highly effective for trend-following, swing, and position traders across all markets. Download it now and integrate it into your MT4 trading strategy to boost your accuracy and confidence.
FAQ
Published:
Nov 11, 2025 21:21 PM
Category: