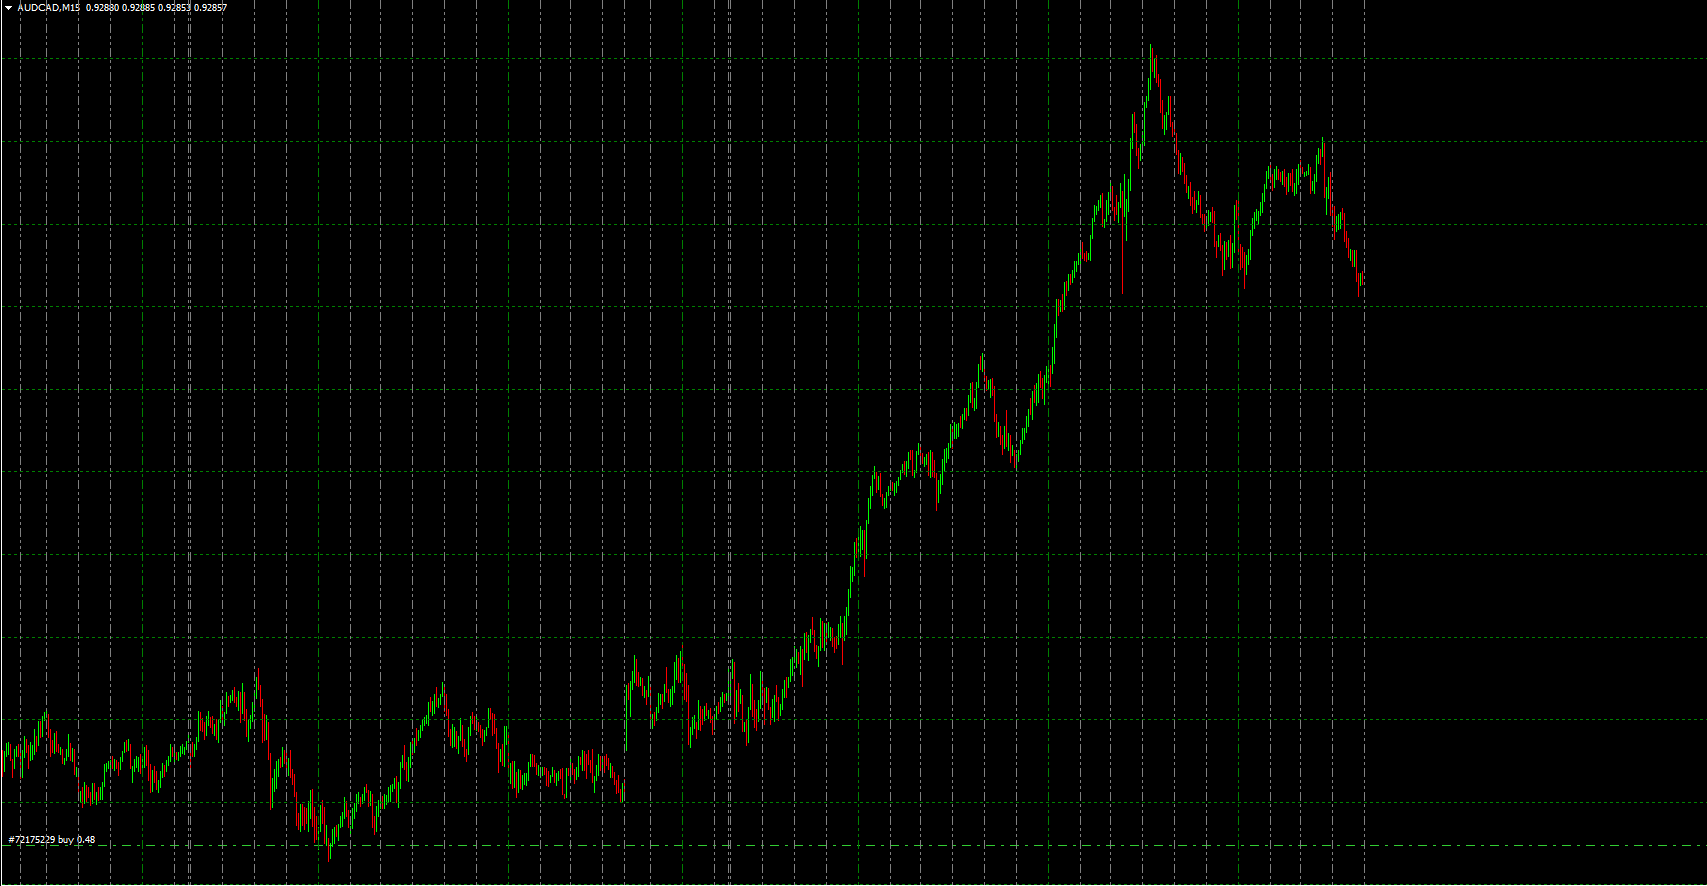
The Grid Indicator is a useful and popular free Forex Indicator for MT4 traders. It is designed to help identify potential price reversal zones, key support and resistance levels, and areas of price consolidation. By plotting evenly spaced horizontal lines on the chart, the indicator creates a grid-like structure that visually represents price movement and market behavior.
This indicator is especially helpful for traders who want a clear and structured way to analyze Price Action. The Grid Indicator simplifies market analysis and allows traders to quickly spot potential entry and exit points across different market conditions.
How the Grid Indicator Works
The Grid Indicator works by plotting a series of horizontal lines on the chart at a user-defined distance apart. These lines form a grid pattern that reflects price movement over time. Each grid level acts as a potential support or resistance zone where price may pause, reverse, or break through.
When price approaches a grid line, traders monitor how it reacts. A rejection from a grid level may indicate a possible reversal, while a strong break through a grid line can suggest Trend Continuation or a new trading opportunity.
Because the grid spacing is customizable, traders can adjust the indicator based on volatility, trading style, or timeframe.
Key Features of the Grid Indicator
Plots horizontal grid levels automatically
Identifies Support And Resistance zones
Highlights potential price reversal areas
Helps detect consolidation and ranging markets
Customizable grid spacing
Free and compatible with all MT4 charts
The indicator provides a clean visual layout without cluttering the trading chart, making it suitable for both beginners and experienced traders.
Benefits of Using the Grid Indicator
The Grid Indicator offers several advantages for Forex traders seeking clarity in Market Structure. One of its biggest benefits is its ability to highlight key price levels that the market repeatedly reacts to.
Main benefits include:
Easier identification of entry and exit points
Clear visualization of price structure
Improved understanding of market range and volatility
Better trade planning and risk management
By using predefined grid levels, traders can reduce emotional decision-making and trade based on objective price zones.
Trading Strategies Using the Grid Indicator
Many traders use the Grid Indicator on higher timeframes such as the 4-hour and daily charts, where support and resistance levels are more reliable. However, it can also be applied to lower timeframes for intraday and scalping strategies.
In ranging markets, traders often buy near lower grid levels and sell near upper grid levels. In trending markets, grid breaks can be used to identify continuation trades. When price consolidates between grid levels, traders may wait for a breakout before entering the market.
The indicator works well when combined with trend indicators, oscillators, or price action analysis for additional confirmation.
Why MT4 Traders Prefer the Grid Indicator
MT4 traders favor the Grid Indicator because of its simplicity, flexibility, and effectiveness. It does not rely on complex calculations or lagging signals, making it ideal for traders who prefer price-based analysis.
Its ability to adapt to any timeframe and market condition makes it a versatile tool for trend trading, range trading, and breakout strategies.
To download the Grid Indicator for free and explore more professional MT4 Forex tools, visit IndicatorForest.com and enhance your trading strategy today.
2 Downloads
Published:
Jan 12, 2026 18:56 PM
Category: