Streamlining Intraday Trends with the Ha T3 1 W LNX Indicator
In technical analysis, mastering short-term trend direction while filtering out market static is the ultimate challenge for day traders and scalpers. Standard momentum oscillators frequently trap retail traders in choppy consolidations, generating a massive amount of false crossover signals. To establish a genuine trading edge, professional market participants rely on smoothed, multi-layered algorithmic engines that evaluate market speed and Trend Strength simultaneously. The Ha T3 1 W LNX indicator addresses this need by providing MetaTrader users with a highly optimized, dual-line oscillator framework designed for precision execution.
The Mathematics of T3 Smoothing and LSMA Logic
To understand why the Ha T3 1 W LNX indicator offers an exceptionally clean view of momentum, it helps to examine its advanced mathematical backend. The indicator is built on a complex intersection of multiple technical calculations running concurrently in a single sub-window pane:
- T3 Moving Average Processing: Developed by Tim Tillson, the T3 smoothing method uses a unique combination of multiple exponential moving averages. Unlike a basic EMA, a T3 average significantly reduces indicator lag while maintaining an incredibly smooth path during volatile market spikes.
- LSMA (Least Squares Moving Average) Alignment: By calculating a linear regression line over a specific historical period, the indicator projects where price mathematically "ought" to be based on the current rate of change.
The Ha T3 1 W LNX engine synthesizes these concepts alongside real-time Commodity Channel Index (CCI) values. This multi-layered mathematical processing filters out raw market noise, ensuring that the indicator lines only shift when genuine institutional volume enters the market.
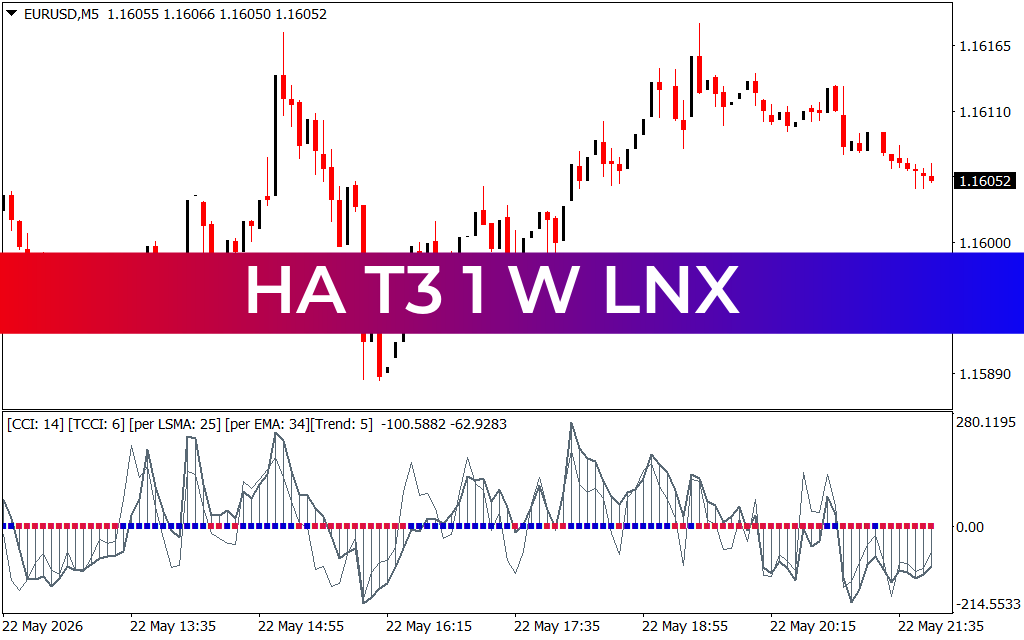
Analyzing the Sub-Window Layout and Trend Squares
As demonstrated on the EURUSD 5-minute (M5) chart, the indicator leaves your primary candlestick workspace entirely clean, shifting its heavy data calculations into an organized indicator sub-window below. The data stream tracks market acceleration by oscillating smoothly around a distinct central zero line:
- The Dual Oscillator Lines: The fast and slow responsive lines track the real-time expansion and contraction of price momentum. When the lines cross sharply above or below the zero line, it signals an immediate shift in intraday market velocity.
- The Color-Coded Zero Axis Squares: Serving as a definitive visual trend matrix, the central axis is populated by uniform, color-coded squares. Continuous blue squares confirm a healthy, mathematically backed bullish trend. Conversely, steady red squares indicate a dominant bearish markdown phase.
This visual arrangement is highly beneficial for fast-paced Scalping environments. Instead of manually drawing trend lines, a quick glance down at the axis squares gives you an objective answer regarding the current intraday bias.
Building a Discipline-Driven Strategy
The Ha T3 1 W LNX indicator serves as an exceptional execution or confirmation engine for modern technical strategies. For maximum consistency, a trader can wait for a corrective pullback on the M5 chart.
When price exhausts its correction and the oscillator lines cross back over the zero axis—perfectly aligning with a fresh block of blue or red squares—it triggers a highly objective, tight-risk entry signal. By taking the guesswork out of momentum scanning, this tool empowers you to execute your edge with absolute discipline and mathematical consistency.
2 Downloads
Last Update:
May 24, 2026 02:14 AM
Published:
Jan 15, 2026 20:00 PM
Category: