Master Price Momentum with the Heiken Ashi Zone Trades Indicator
Intraday traders and fast-paced scalpers often face a major obstacle on lower-timeframe charts: noise. Standard candlestick charts are highly vulnerable to erratic price spikes and counter-trend gaps, which can lead to emotional overtrading and costly false entries. The Heiken Ashi Zone Trades indicator offers an elite, systematic alternative. By averaging price data to filter out market noise, this advanced technical tool reveals the true underlying trend and isolates high-probability execution zones directly on your MetaTrader terminal.
This premium software tool transforms your chart into a beautifully streamlined workspace, enabling you to build a rules-based system for riding institutional momentum.
Understanding the Mechanics of Heiken Ashi Zones
Traditional candlesticks focus strictly on open, high, low, and close values per interval. In contrast, Heiken Ashi calculations apply a smoothed formula to open-close metrics, making it easier to see when a trend is actually changing. The Heiken Ashi Zone Trades indicator takes this classic mathematical framework a step further by introducing multi-state, color-coded momentum zones.
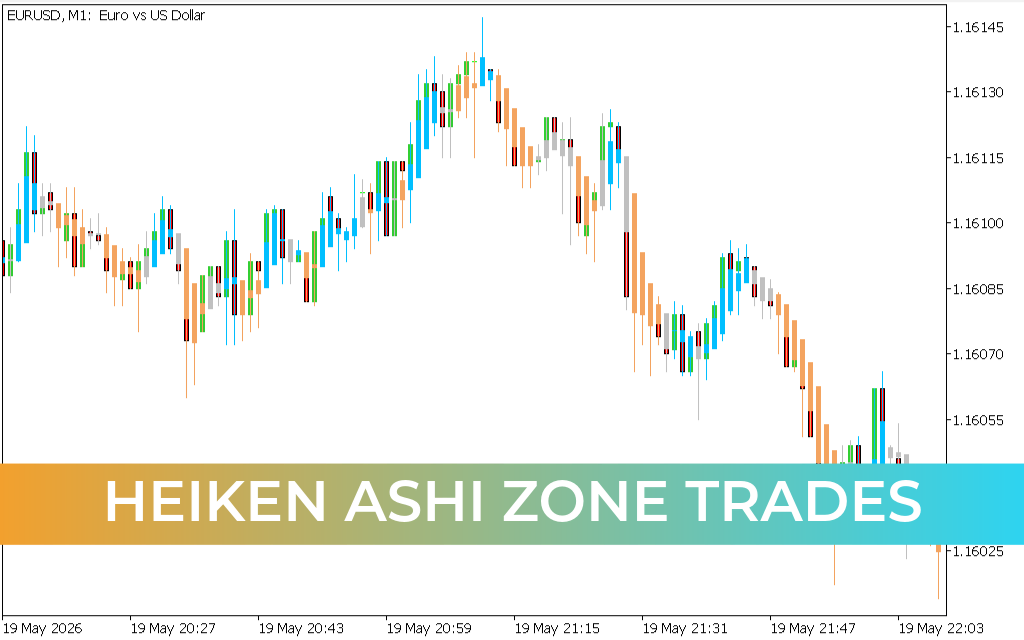
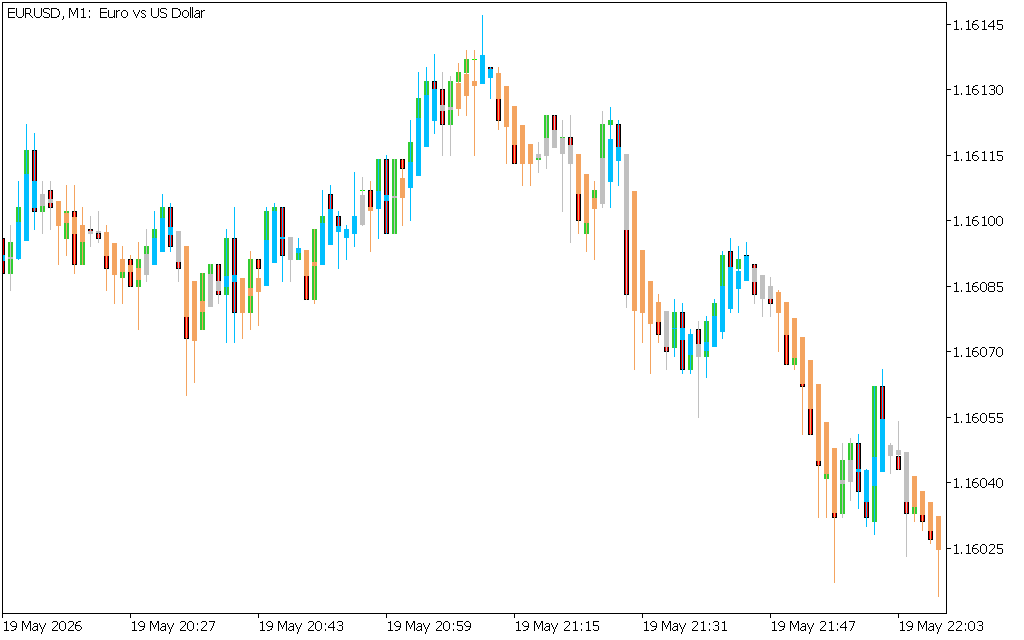
As demonstrated on the 1-minute ($M1$) EUR/USD price canvas, the software eliminates chaotic chart patterns and replaces them with a clean, color-coordinated trend map:
- Aggressive Bullish Momentum (Cyan/Blue Bars): When institutional buying volume surges, the indicator colors the candlesticks a bright cyan. This visual setup tells the technical analyst that a powerful upward expansion is underway, making it safe to enter long positions.
- Standard Trend Extensions (Green Bars): Smooth green candles print as a bull market stabilizes, showing steady upward momentum while filtering out temporary down-ticks.
- Aggressive Bearish Distribution (Orange/Red Bars): When a market markdown phase takes over, the bars instantly switch to a distinct orange tint. This clear visual alert shows heavy seller distribution, giving day traders an early signal to look for short positions.
- Neutral Consolidation Phases (Grey Bars): During quiet, low-volume sessions, the indicator turns grey. This feature flags sideways market contraction, helping you avoid bad entries when there is no clear trend.
Executing a Rule-Based Trend System
Integrating the Heiken Ashi Zone Trades utility into your daily trading workspace removes emotional guesswork, giving you an objective plan for managing trends.
1. Trading the Structural Reversal Zone
The most reliable setups occur when the market transitions out of a flat consolidation phase. When an asset breaks out of a tight range and the candles shift from a neutral grey to a decisive cyan or orange, it marks the official start of a new institutional trend. This transition gives day traders a high-probability trigger to enter the market early in the move.
2. Filtering Pullbacks with Precision
During strong, trending sessions, the market will naturally experience brief counter-trend pullbacks. While standard charts can make these dips look scary, the Heiken Ashi Zone Trades indicator keeps you grounded. If the price pulls back slightly but the candles stay green or blue, it confirms that the broader trend remains intact, allowing you to hold your positions for maximum profit.
Conclusion
The Heiken Ashi Zone Trades indicator is a vital addition to any MetaTrader setup focused on systematic trend following. By turning chaotic Price Action into clear, color-coded momentum zones, it takes the hesitation out of your daily trading routine. Download Heiken Ashi Zone Trades today to upgrade your charting workspace and trade market trends with absolute clarity.
3 Downloads
Last Update:
May 20, 2026 02:26 AM
Published:
Jan 18, 2026 19:53 PM
Category: