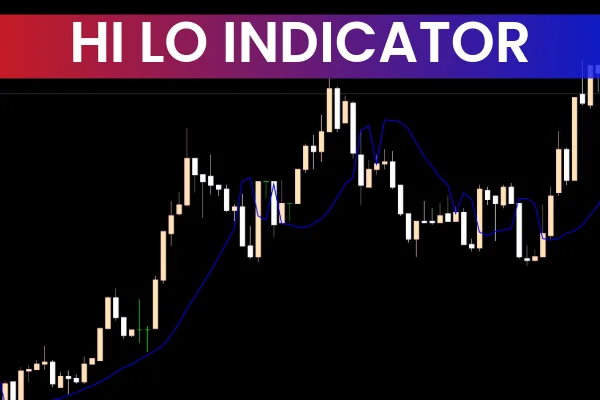
The Hi Lo Indicator for MetaTrader 5 is a trend-following technical tool that identifies market direction using bullish and bearish signal points. This user-friendly system is valuable during technical analysis and trade execution, offering traders a clear view of Trend Strength and momentum.
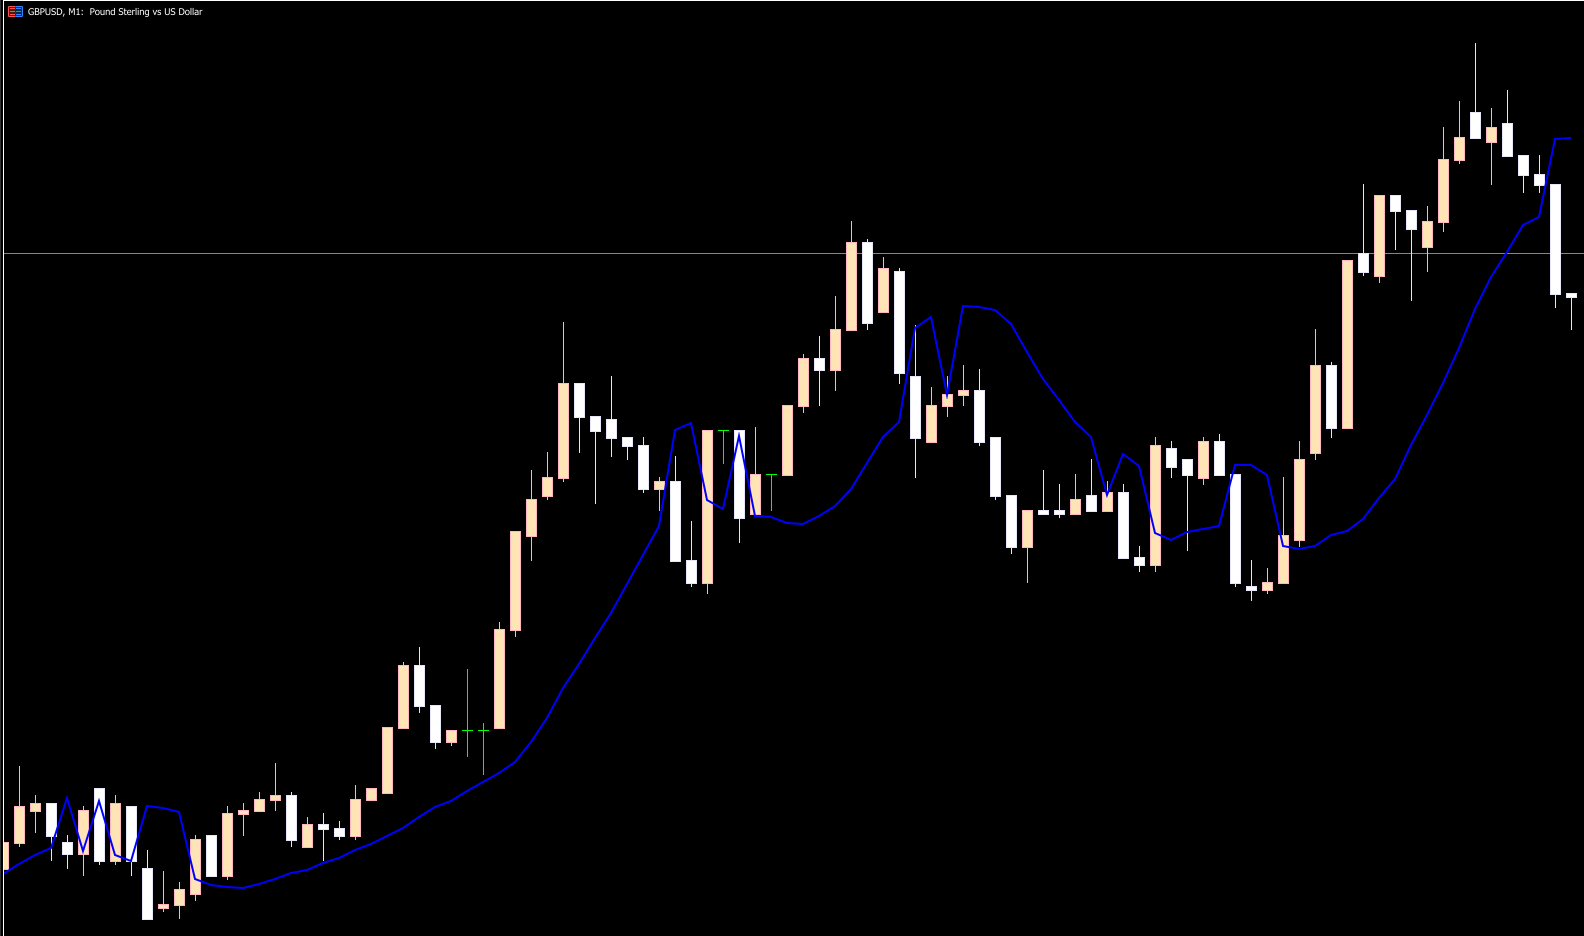
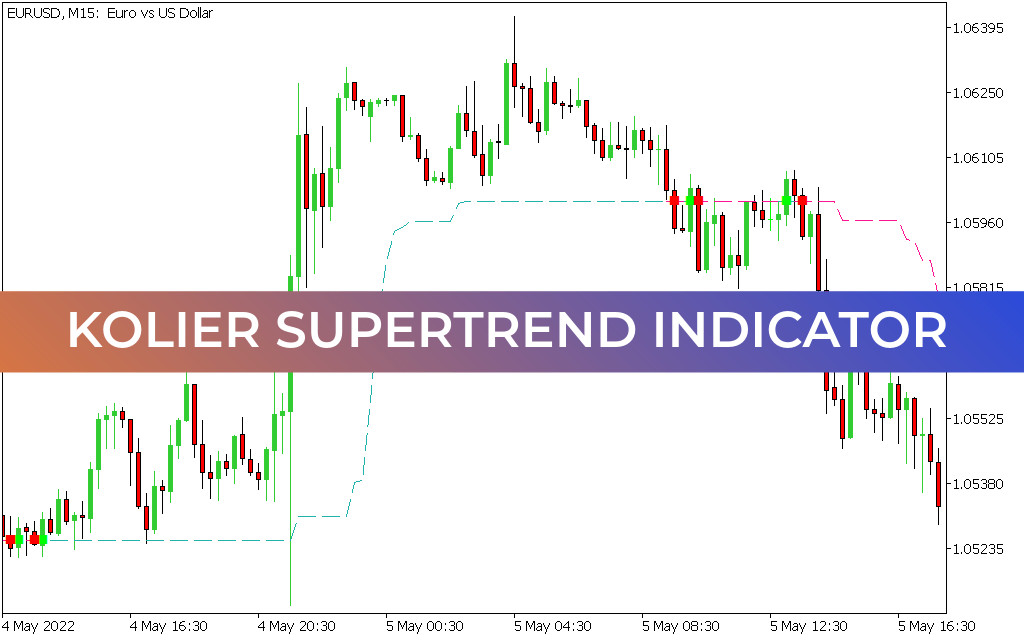
One of the standout features of the Hi Lo Indicator is its accuracy. The signal points do not repaint, making the indicator highly reliable. Once a blue line appears above or below the price, it remains unchanged even after the candle closes. This characteristic ensures confidence in trend interpretation and entry timing.
The indicator is extremely useful for scalpers, intraday traders, and swing traders, as it makes it easy to determine whether an asset is trending. It also helps in identifying the potential end of bullish or bearish pullbacks, providing an edge in timing market reversals or continuations.
Discover More
MetaTrader 5 • MT4 • MT5 • Algo Trading • MetaTrader 4 • Algorithmic Trading • MetaTrader 4 Indicators • MT4 Expert Advisors • MT4 Scripts Download • Forex Indicators MT4
How to Use the Hi Lo Indicator
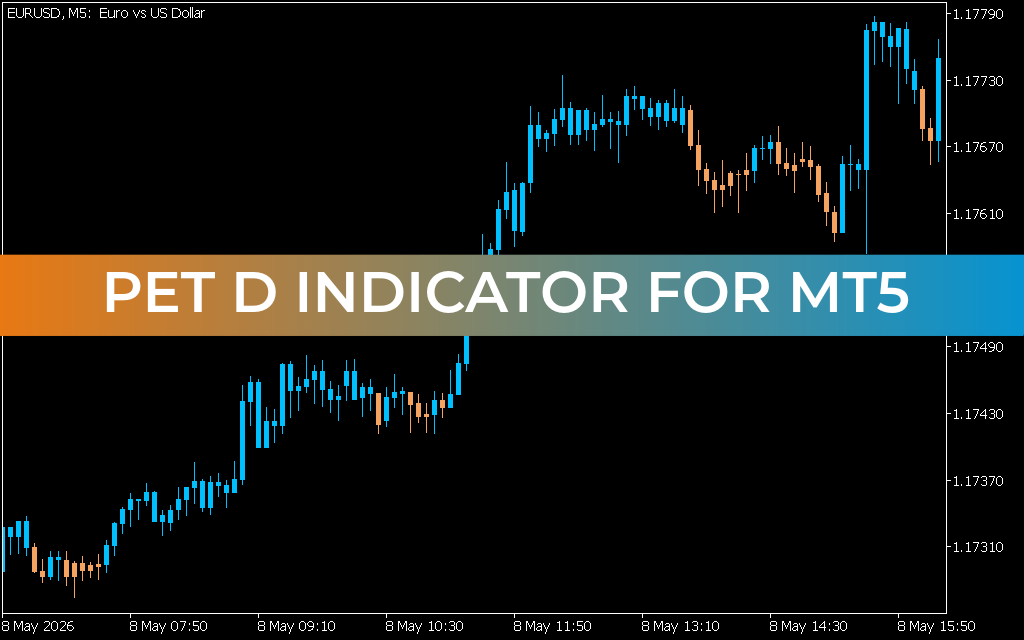
The Hi Lo Indicator is highly sensitive to trend movements. On a chart, it displays a blue line below the price during bullish movement and above the price during bearish movement. This makes identifying trend direction straightforward at a glance.
The tool is most effective in trending markets, where traders can use it to join an existing trend after a minor pullback. For improved accuracy, it is recommended to combine the indicator with price action techniques or other confluence tools to pinpoint optimal entry zones.
Conclusion
The Hi Lo Indicator for MT5 is a simple yet powerful tool for detecting market direction and identifying potential trade entry or exit zones. Its non-repainting nature and trend-following structure make it ideal for traders of all levels. Best of all, the indicator is free to download and can significantly enhance your market analysis.
FAQ
3 Downloads
Published:
Dec 08, 2025 03:43 AM
Category: