Mastering Forex Swings: The Ultimate Highest Lowest Indicator for MT5
In the fast-paced world of Forex trading, precision timing is everything. Whether you are a scalper capitalizing on minor price movements or a swing trader riding macroeconomic trends, identifying exact market turning points is the key to profitability. The Highest Lowest Indicator for MT5 is a powerful technical analysis tool designed to eliminate guesswork by automatically identifying and plotting critical swing highs and swing lows on your charts.
What is the Highest Lowest Indicator?
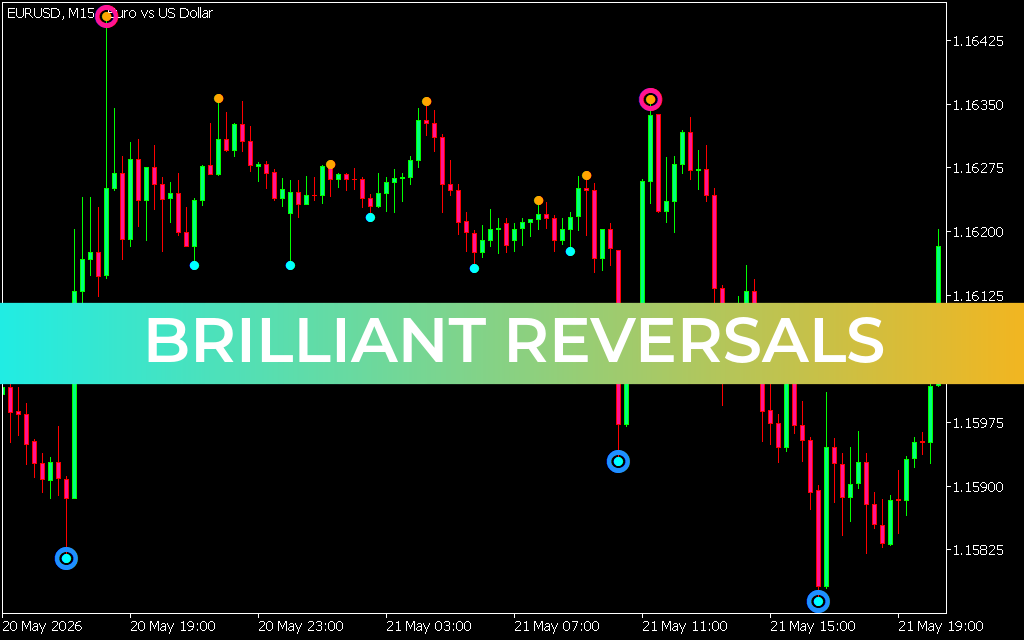
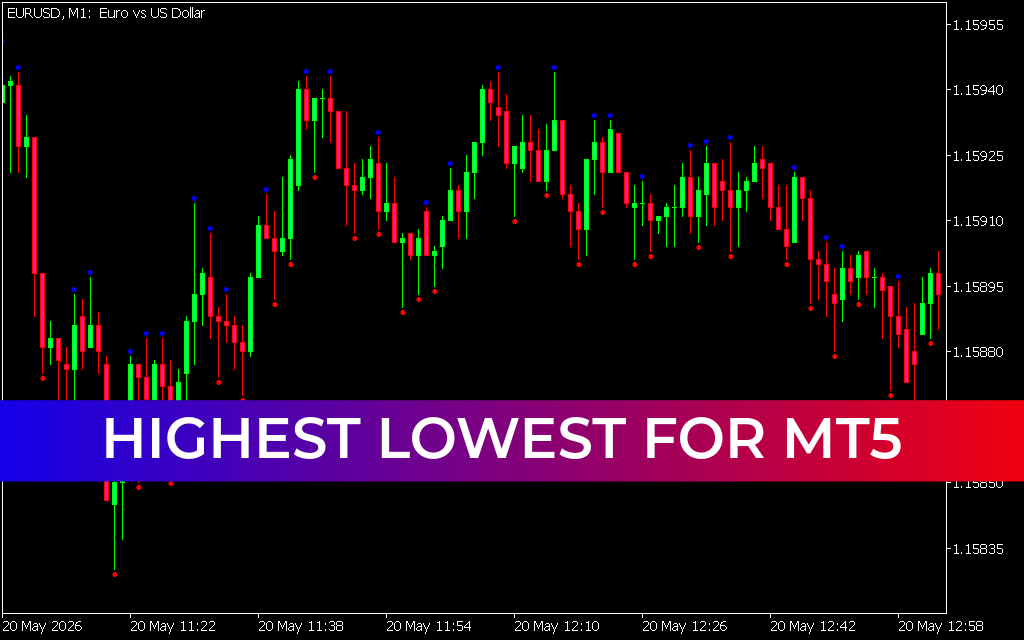
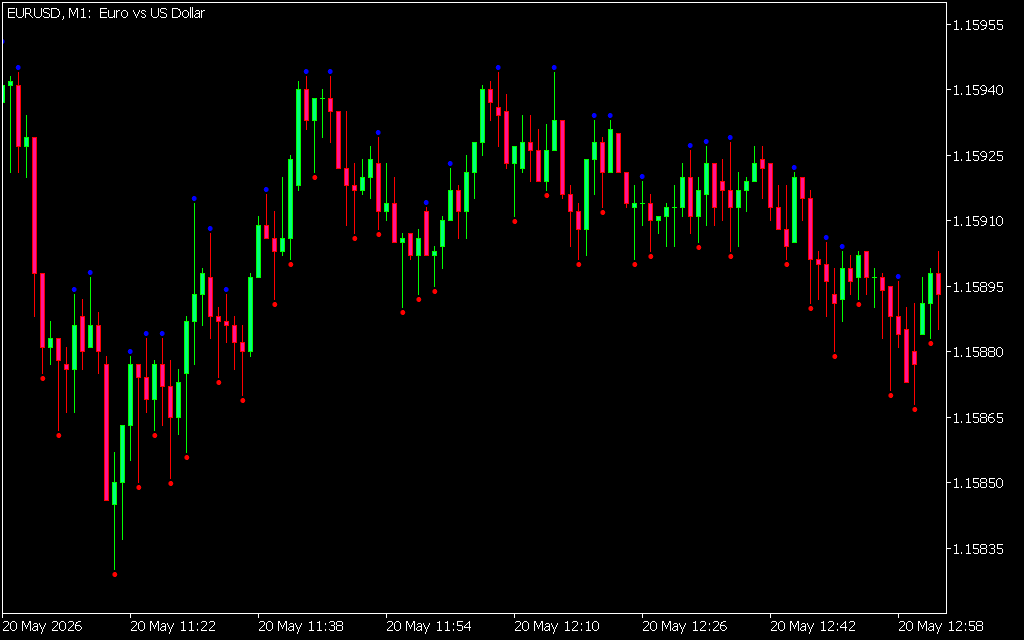
The Highest Lowest Indicator is a dynamic chart overlay for the MetaTrader 5 platform that scans historical Price Action over a user-defined period to highlight the absolute highest and lowest price points. As seen in the EURUSD 1-minute chart, the indicator uses intuitive visual cues—placing blue dots above peak resistance levels and red dots below valley support levels.
By automatically anchoring these pivotal zones, the indicator saves traders from the tedious task of manually drawing Support And Resistance lines, allowing for rapid decision-making in real-time market conditions.
Key Benefits for Forex Traders
- Automated Support and Resistance: Markets move in waves. This indicator instantly flags local extrema, giving you clear visual boundaries for potential price reversals or breakouts.
- Enhanced Risk Management: Placing stop-loss orders just beyond recent structural highs or lows is a cornerstone of sound risk management. This tool provides the exact coordinates needed to protect your capital.
- Versatility Across Timeframes: While highly effective for low-timeframe Scalping (such as the M1 chart shown), the indicator seamlessly adapts to hourly, daily, or weekly charts for long-term position traders.
- Clutter-Free Visuals: Unlike bulky oscillators that crowd the bottom of your screen, this indicator sits cleanly on the price candles, ensuring your workspace remains organized and actionable.
How to Trade with the Highest Lowest Indicator
The truest value of the Highest Lowest tool lies in its ability to confirm Market Structure. When price approaches a previous blue dot (high) and fails to break through, it signals a potential double top or resistance rejection, offering a prime shorting opportunity. Conversely, when price tests a red dot (low) and bounces, a strong buying opportunity emerges.
For the best results, combine this indicator with volume analysis or momentum oscillators like the RSI to confirm breakout validity and avoid false signals. strategies.
Last Update:
May 21, 2026 16:10 PM
Published:
Jan 18, 2026 13:31 PM
Category: