Following Market Trends with the HILO Activator Indicator
Identifying the prevailing trend and finding logical placement for trailing stop-losses are two of the most critical components of a successful trading plan. While standard moving averages are excellent for smoothing out price data, they often lack the immediate responsiveness required for precise intraday trade management. To solve this, technical analysts frequently turn to volatility-based trailing indicators. Among the most reliable tools in this category on the MetaTrader platform is the HILO Activator Indicator.
Designed to track directional momentum while offering structural protection, this tool serves as an excellent foundational indicator for scalpers, day traders, and swing traders alike.
Understanding the HILO Activator
The HILO Activator is a trend-following indicator derived from the moving averages of the highs and lows over a specified period. It calculates whether the current Price Action is trading above or below these historic ranges to determine market bias.
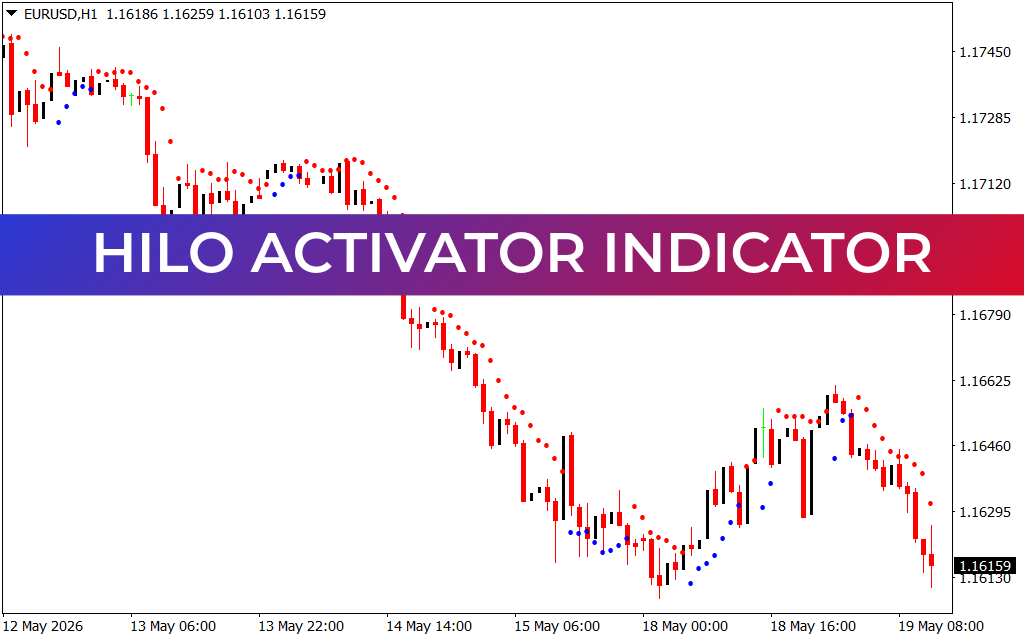
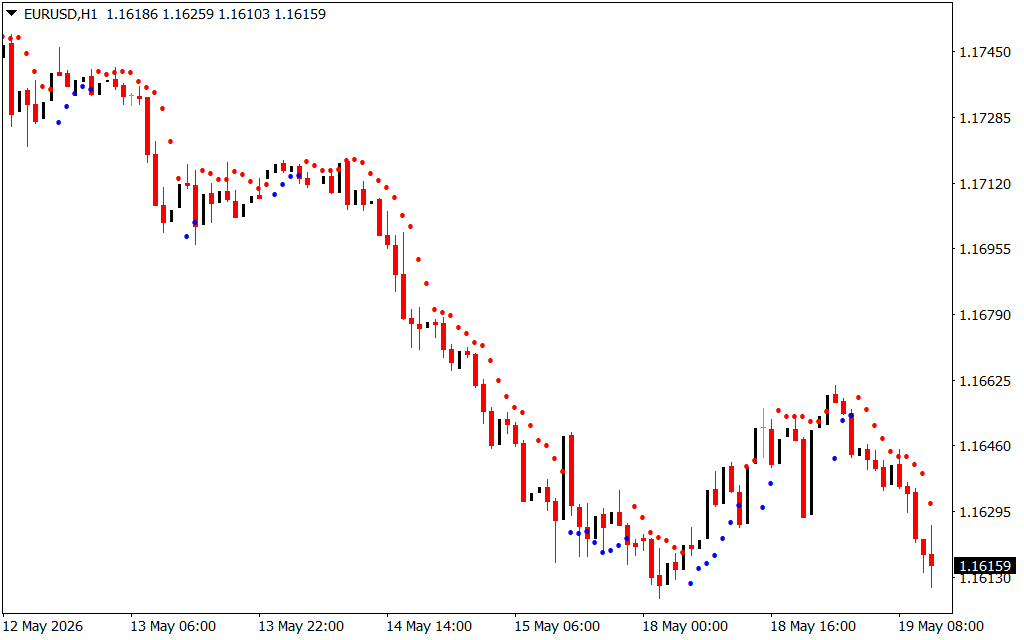
Rather than plotting a standard continuous line across the chart, the HILO Activator displays a series of visual dots directly above or below the candlesticks, as seen on the 1-hour (H1) chart:
- Blue Dots Below Price: Indicates that the market is in an established uptrend, signaling a strong bullish bias.
- Red Dots Above Price: Indicates that the market is experiencing a downtrend, showcasing a clear bearish bias.
When price closes on the opposite side of the dots, the indicator flips its positioning, signaling a potential Trend Reversal or a shift in near-term momentum.
Core Trading Strategies and System Integration
The HILO Activator stands out because it acts as both an entry trigger and an active risk management engine.
1. Dynamic Stop-Loss Tracking
One of the primary use cases for the HILO Activator is as a dynamic trailing stop-loss indicator. When in a short position during a market markdown (like the EUR/USD downtrend shown on the chart), a trader can trail their stop-loss just a few pips above the red dots. This structural trailing method allows you to ride strong macro trends while guaranteeing that you exit the trade the moment momentum officially shifts against you.
2. Reversal Entry Trigger
Traders often use the color-coded flip of the dots as a direct trade trigger. A shift from red dots above price to blue dots below price suggests that buyers are reclaiming the market range, serving as a buy signal. For best results, traders wait for a candle to completely close to confirm the breakout before executing.
3. Filtering Out False Breakouts
During volatile or choppy market conditions, standalone indicators can suffer from whipsaws. To maximize the performance of the HILO Activator, it is highly recommended to pair it with a higher-timeframe trend filter, such as a 200-period Exponential Moving Average (EMA). By only taking buy signals when price is above the 200 EMA and sell signals when price is below it, you can easily filter out low-probability counter-trend traps.
Optimizing Your Trade Management
The HILO Activator Indicator streamlines your execution window by replacing subjective analysis with mechanical rules. By providing crystal-clear visual indications of trend direction and institutional trailing levels, it helps eliminate second-guessing during live market environments. Whether you are hunting quick intraday moves or holding positions overnight, this tool is an essential asset for building a structured, rule-based approach to the markets.
1 Download
Last Update:
May 19, 2026 15:51 PM
Published:
Jan 19, 2026 19:57 PM
Category: