Advanced Momentum Tracking: The Histogram Alert Ema V1 Indicator
In the financial markets, precision timing is everything. While traditional moving averages are exceptional at confirming established trend directions, they are notoriously slow at spotting initial momentum shifts, often entering trades just as a market moves into overextended territory. To counter this inherent lag, professional technical analysis often pairs moving averages with classic momentum oscillators. The Histogram Alert Ema V1 Indicator merges these two worlds, combining an optimized Moving Average Convergence Divergence (MACD) structure with automated visual alerts.
Here is a comprehensive breakdown of how this sub-window indicator operates and how you can deploy it to catch powerful market swings early.
The Anatomy of the Histogram Alert Ema V1
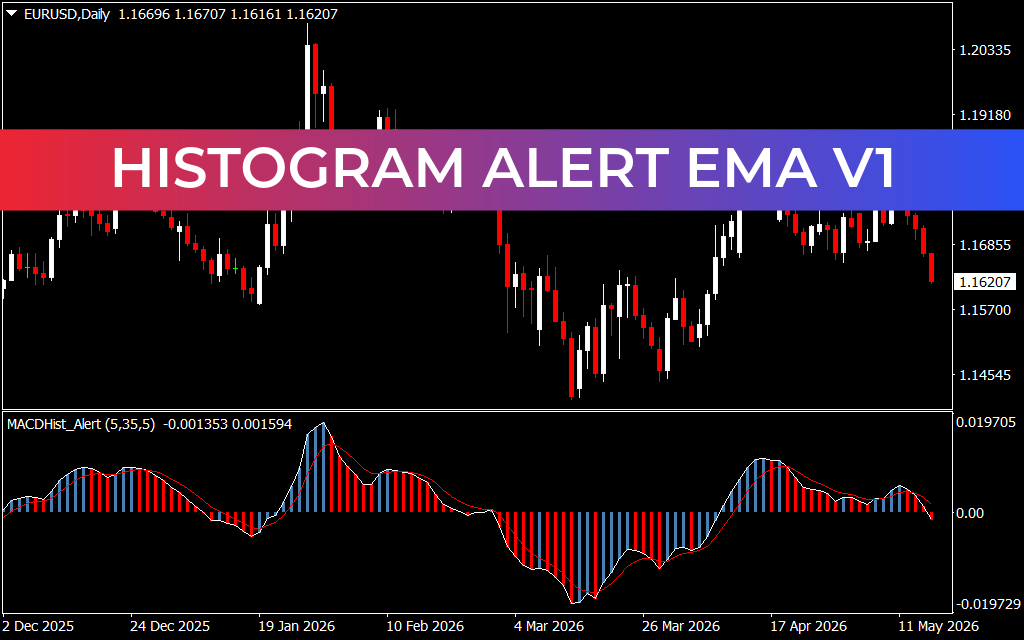
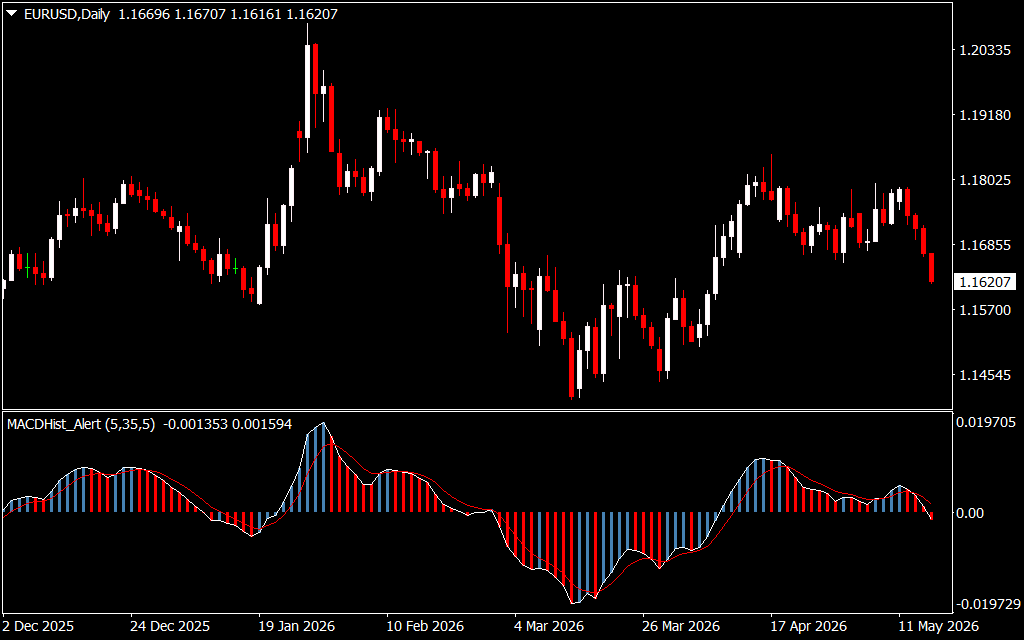
The indicator operates in a dedicated sub-window underneath your main chart terminal, ensuring your price view stays clean and clear of clutter. It calculates momentum using three distinct mathematical variables visible in its settings: (5, 35, 5).
This setting represents a fast Exponential Moving Average (EMA), a slow EMA, and a smoothing signal line. By plotting the difference between these averages as a dual-colored vertical histogram, the tool maps out the acceleration and deceleration of institutional capital in real time.
Interpreting the Visual Cues and Alerts
As shown on the EUR/USD Daily chart, the indicator simplifies complex convergence and divergence data into actionable, color-coded components:
- The Zero-Line Baseline: The horizontal 0.00 center line acts as the ultimate balance of power boundary. When the histogram is printing above zero, buyers dominate the macroeconomic landscape; below zero, sellers are firmly in control.
- The Dual-Color Momentum Bars: * Light Blue Bars: Indicate expanding bullish momentum or contracting bearish pressure.
- Red Bars: Alert the trader to expanding bearish momentum or fading bullish strength.
- The Signal Line Crossover: The smooth white line tracks a trailing average of the histogram itself. When the histogram crosses through this line, it provides an early execution alert that momentum is shifting—long before a structural price breakthrough occurs on the candlestick chart above.
For example, on the daily chart, as the EUR/USD trended lower into early March, the red histogram bars reached a deep extreme before contracting back toward the white signal line. This visual squeeze provided an advanced warning that the selling climax was exhausting itself, opening the door for a powerful upward reversal.
Strategic Optimization for Active Terminals
To get the most out of the Histogram Alert Ema V1 system, apply these core trading principles:
- Trade the Divergence: Watch for moments where Price Action makes a new structural high, but the histogram bars print a lower high. This bearish divergence signals a hollow trend that is highly prone to a sudden, violent reversal.
- Multi-Timeframe Filtering: Use the Daily or H4 chart to establish your primary directional bias using the zero-line boundary. Then, drop down to an intraday chart (like the M15 or M5) and only take signal line crossovers that align with that larger macro trend.
- Automated Exit Discipline: If you are riding a long swing trade, an official crossover where the histogram slips beneath the white signal line serves as an objective rule-based trigger to exit the market or trail your stop-loss higher.
52 Downloads
Last Update:
May 17, 2026 01:46 AM
Published:
Jan 21, 2026 01:10 AM
Category: