The Histogram Divergence Indicator for MT4 is a popular and free Forex trading tool designed to help traders identify potential buy and sell opportunities using divergence analysis. Built for the MetaTrader 4 platform, this indicator uses the MACD histogram to compare price movements and reveal hidden changes in market momentum. Divergence is a powerful concept in technical analysis, often signaling possible trend reversals or weakening trends before they appear on price charts.
Thanks to its simple visual design and ease of use, the Histogram Divergence Indicator for MT4 is suitable for both beginner and experienced traders.
What Is the Histogram Divergence Indicator for MT4
The Histogram Divergence Indicator for MT4 is based on the Moving Average Convergence Divergence indicator. Instead of focusing only on crossovers, it analyzes the relationship between price movement and MACD momentum.
By comparing two price series, the indicator detects divergences where price continues in one direction while momentum begins to weaken. These situations often indicate potential reversals or corrective moves in the market.
How the Indicator Works
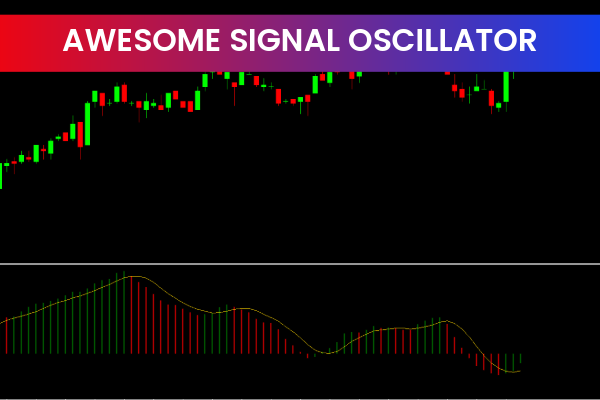
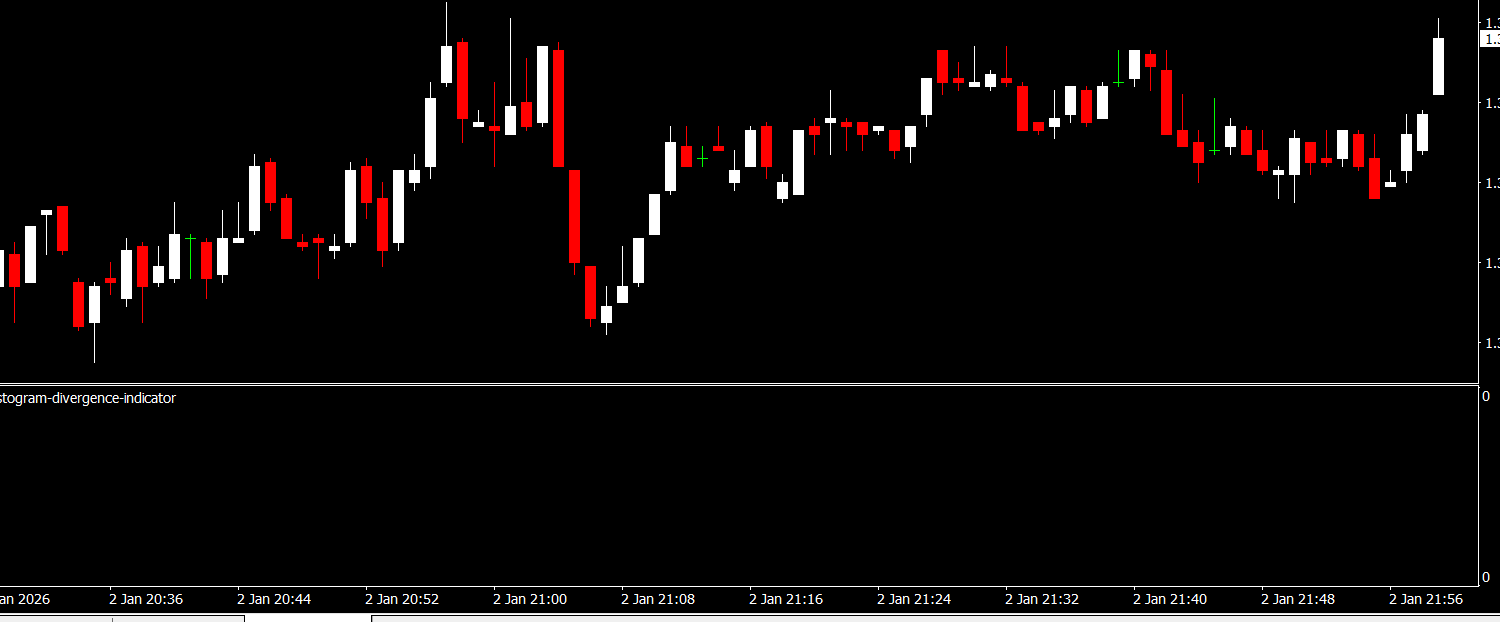
The indicator calculates the difference between the MACD line and the signal line, displaying the result as a histogram. This histogram visually represents momentum strength.
When the difference is positive, the histogram appears green, indicating bullish momentum. When the difference is negative, the histogram turns red, signaling bearish momentum. The size of the histogram bars reflects the strength of the divergence between price and momentum.
Larger histogram bars suggest stronger divergence, while smaller bars indicate weakening momentum. This visual feedback helps traders quickly assess market conditions.
Key Features and Benefits
MACD-Based Divergence Detection
The indicator leverages the proven MACD methodology to highlight divergence, a concept widely used by professional traders.
Clear Visual Histogram
The green and red histogram bars make it easy to identify bullish and bearish momentum without cluttering the chart.
Strength Measurement
The size of the histogram bars helps traders evaluate how strong a divergence is, improving trade timing and confidence.
Beginner-Friendly Design
The Histogram Divergence Indicator for MT4 is easy to understand and does not require advanced technical knowledge.
How Traders Use Divergence in Trading
Traders often use divergence as a confirmation signal rather than a standalone trigger. For example, bearish divergence may appear when price makes higher highs while the histogram forms lower highs, suggesting weakening buying pressure.
Similarly, bullish divergence may occur when price makes lower lows but the histogram shows increasing momentum. These conditions can help traders anticipate reversals or trend pauses.
The indicator works well when combined with Support And Resistance levels, trendlines, or candlestick patterns. It can be used on all timeframes, making it suitable for scalping, day trading, and swing trading.
Why Traders Choose This Indicator
The Histogram Divergence Indicator for MT4 remains popular because it simplifies a powerful trading concept into an easy-to-read visual format. Traders appreciate its clarity, reliability, and ability to highlight early warning signs in the market.
It helps reduce emotional decision-making by providing objective momentum-based signals.
Final Thoughts
The Histogram Divergence Indicator for MT4 is a reliable and free Forex Indicator that helps traders identify potential buy and sell signals through MACD histogram divergence. Its clear visual design and ease of use make it a valuable addition to any MT4 trading strategy.
To access more free MT4 indicators, divergence tools, and professional Forex resources, visit IndicatorForest.com and improve your trading decisions today.
Published:
Jan 03, 2026 18:15 PM
Category: