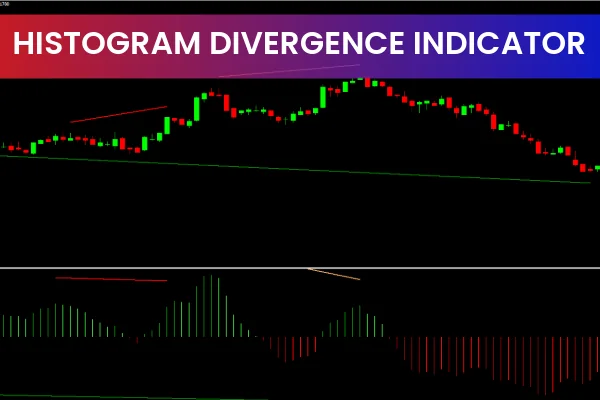
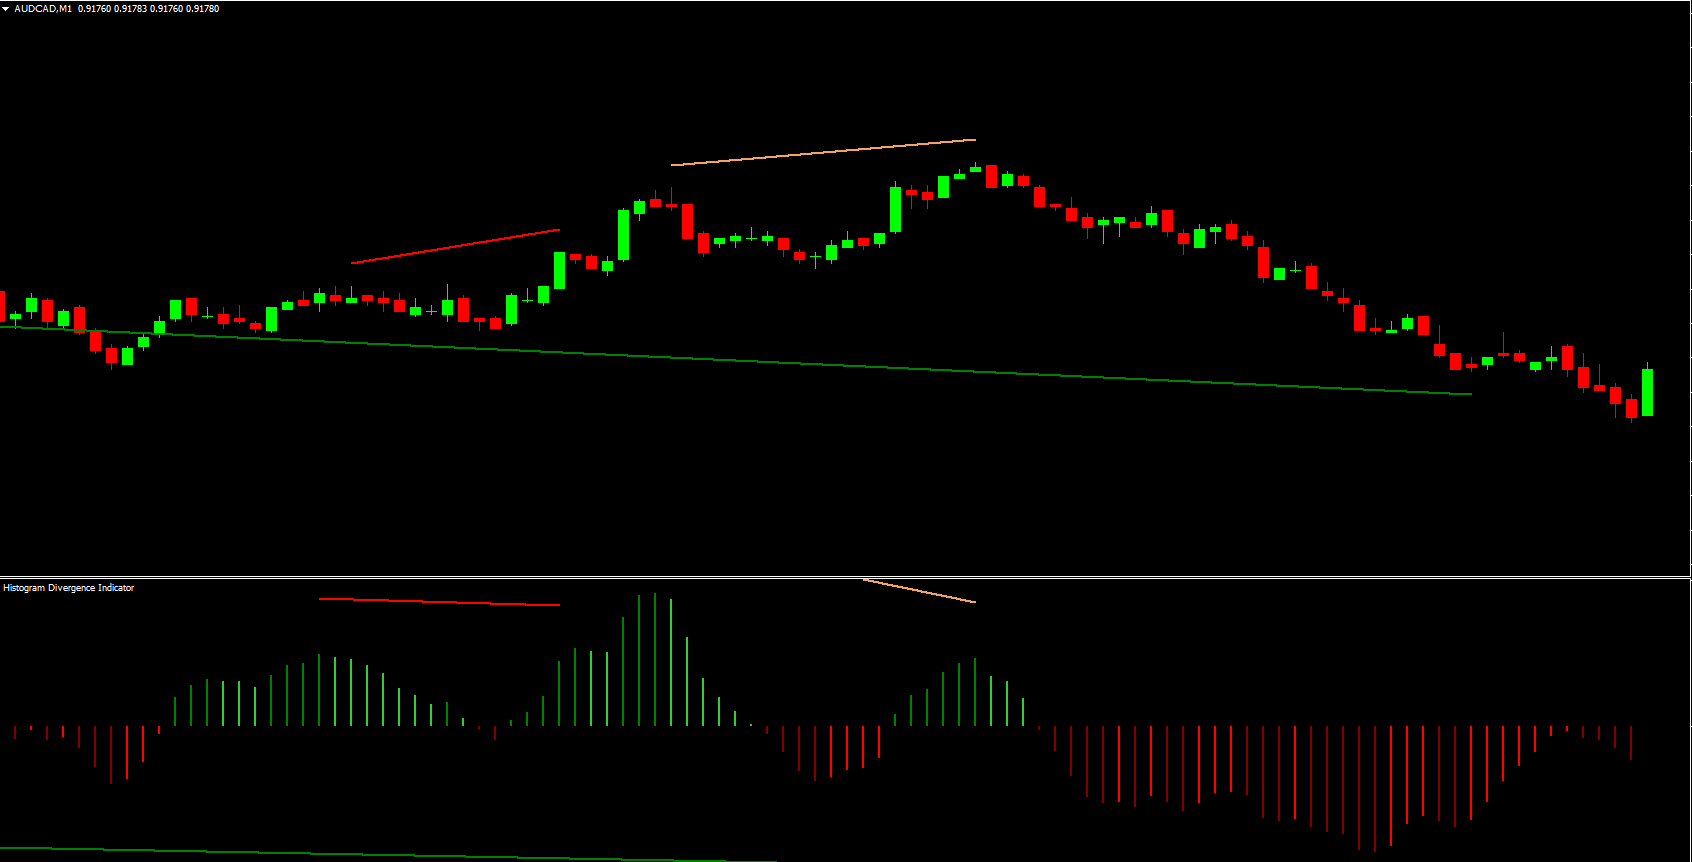
The Histogram Divergence Indicator for MT4 is a powerful tool that automatically detects and plots divergence between Price Action and the classic MACD (Moving Average Convergence Divergence) indicator. It draws bullish and bearish divergence lines directly on both the chart and the indicator window, making it extremely simple for traders to spot upcoming trend reversals.
The indicator works seamlessly on all intraday timeframes, as well as daily, weekly, and monthly charts, making it suitable for day traders, swing traders, scalpers, and long-term traders alike. Since divergence trading can be risky and prone to false signals, traders—especially advanced ones—typically combine this tool with price action, Support And Resistance zones, trendlines, or additional momentum indicators to confirm reversals.
How the Histogram Divergence Indicator Works
The indicator applies the MACD formula to monitor momentum shifts between price movements and indicator readings. Divergence occurs when:
Price makes higher highs but the indicator makes lower highs → Bearish Divergence
Price makes lower lows but the indicator makes higher lows → Bullish Divergence
The Histogram Divergence Indicator automates this entire process by:
Scanning price and MACD values
Identifying valid divergence formations
Marking lines on both price chart and histogram window
Coloring MACD histogram bars (dark red, red, dark green, green) to reflect strength and momentum
This makes divergence trading much easier, especially for newer traders who struggle to draw trendlines manually.
Trading Signals From the Histogram Divergence Indicator
Bullish Divergence Signal
When the indicator detects a bullish divergence, it plots a trendline below the price and indicator lows. This suggests downward momentum is weakening and a reversal to the upside may occur.
Suggested approach:
Enter a buy position
Place stop-loss below the previous swing low
Use your own profit target based on risk-reward or structure, as the indicator does not provide TP levels
Bearish Divergence Signal
When a bearish divergence is detected, the line is drawn above the price highs and indicator peaks. This signals weakening upward momentum and a possible downward reversal.
Suggested approach:
Enter a sell position
Place stop-loss above the previous swing high
Strengths and Limitations of Divergence Trading
Divergence is a powerful reversal technique, but it is not perfect. The indicator may detect divergence early, and price may continue moving in the current trend before reversing. This happens when there are still large market participants pushing the trend further.
Here’s how traders improve accuracy:
Best Practices for Strong Divergence Signals
Look for divergence near major support and resistance zones
Combine with RSI to confirm momentum loss
Check higher timeframe divergence for stronger, long-lasting reversals
Use chart patterns like double tops or double bottoms as confirmation
Validate break of structure before entry
Higher vs Lower Timeframes
Higher timeframes (H4, D1, W1):
Fewer signals
Larger, more profitable moves
High accuracy
Lower timeframes (M1, M5, M15):
Frequent signals
Good for scalpers and day traders
Higher chance of false signals
This makes the Histogram Divergence Indicator a versatile tool for all trading styles.
Conclusion
The Histogram Divergence Indicator for MT4 is an essential tool for traders who rely on momentum shifts and early reversal detection. With automatic divergence plotting, colored histogram bars, and compatibility with all timeframes, it simplifies one of the most profitable trading techniques available. Traders should still confirm reversals through price action or additional indicators, but the Histogram Divergence tool provides a strong foundation for identifying turning points.
Download this indicator for free and upgrade your trading strategy at IndicatorForest.com.
FAQ
Published:
Dec 07, 2025 00:03 AM
Category: