The Historical Correlation Indicator for MetaTrader 4 (MT4) is a powerful analytical tool that helps traders understand how different currency pairs move in relation to each other. By using the Pearson correlation coefficient, this indicator reveals the degree to which two assets are positively or negatively correlated.

How the Historical Correlation Indicator Works
At its core, the Historical Correlation Indicator measures the statistical relationship between two or more financial instruments over a chosen period. The resulting correlation value ranges between +1 and -1:
+1 → Perfect positive correlation: both instruments move in the same direction.
0 → No correlation: movements are unrelated.
-1 → Perfect negative correlation: instruments move in opposite directions.
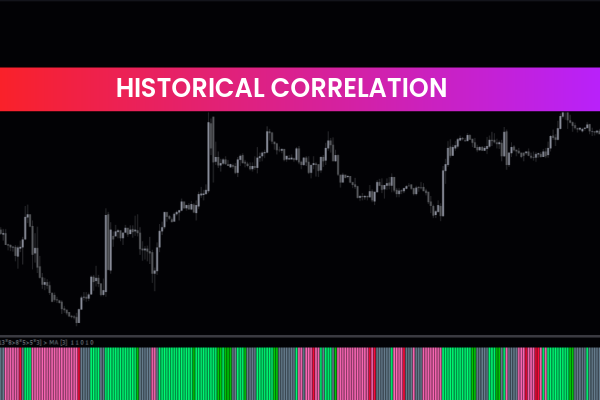
In MetaTrader 4, the indicator typically displays these relationships using a multi-line chart, allowing traders to easily compare multiple pairs at once. For example, EUR/USD and GBP/USD often show a strong positive correlation, while EUR/USD and USD/JPY may display a negative one.
This visualization helps traders spot patterns, confirm trade setups, or avoid redundant trades that expose them to the same directional risk.
Benefits of Using the Historical Correlation Indicator
1. Better Risk Management
Correlation analysis allows traders to manage exposure effectively. If two positions are highly correlated, both may react similarly to market events, doubling potential losses. The indicator helps identify such risks before they occur.
2. Improved Trade Confirmation
Traders can use the Historical Correlation Indicator to validate their setups. For instance, if a trader sees a bullish pattern on EUR/USD, checking whether GBP/USD shows similar movement can provide confirmation—or a reason to stay cautious.
3. Portfolio Diversification
Understanding correlations between assets allows for better diversification. By choosing pairs that move independently or inversely, traders can balance their portfolio and reduce overall volatility.
Practical Applications in Trading
1. Hedging Strategies
The indicator helps traders identify negatively correlated pairs suitable for hedging. For example, if you hold a long position on EUR/USD, opening a short on USD/CHF may offset potential losses if market sentiment shifts.
2. Avoiding Overexposure
Trading multiple positively correlated pairs can magnify risk unintentionally. The Historical Correlation Indicator alerts you to overlapping exposures, ensuring a balanced approach to trade management.
3. Identifying Divergences
When two strongly correlated assets begin to diverge, it can signal potential trading opportunities. A sudden shift in correlation might indicate a developing trend or reversal worth investigating further.
How to Use the Indicator in MetaTrader 4
Install the Historical Correlation Indicator on your MT4 platform.
Select multiple instruments (e.g., EUR/USD, GBP/USD, USD/JPY).
Choose your correlation period (commonly 50–100 bars).
Analyze the correlation lines on your chart for trends and shifts.
Monitoring these relationships over time allows traders to align their strategies with broader market dynamics, improving both precision and profitability.
Conclusion
The Historical Correlation Indicator for MT4 is an indispensable tool for any trader managing multiple instruments. By visualizing relationships between currency pairs, it enhances decision-making, strengthens strategy confirmation, and promotes better risk management.
Whether you’re seeking to hedge trades, avoid overexposure, or identify early market shifts, the Historical Correlation Indicator brings powerful analytical depth to your MetaTrader 4 toolkit.
👉 Explore the full range of advanced trading tools at IndicatorForest.com and take your market analysis to the next level.
2 Downloads
Published:
Jan 01, 2026 10:57 AM
Category: