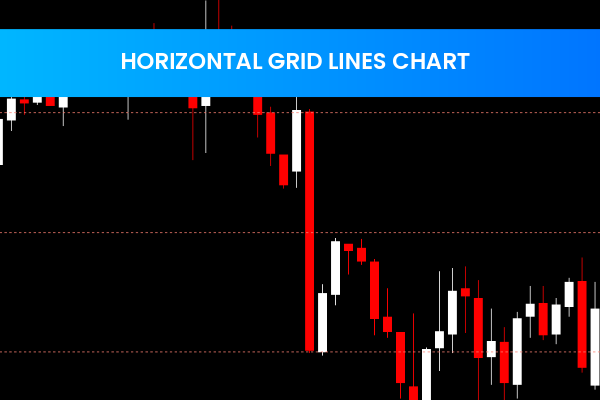
The Horizontal Grid Lines Chart Indicator for MT4 is a widely popular and practical Forex Indicator that helps traders visually identify important price levels on their charts. This free indicator overlays horizontal grid lines directly onto the price chart, making it easier to analyze market structure and recognize key Support And Resistance zones. Designed specifically for the MetaTrader 4 platform, it is a valuable tool for traders who rely on clean and effective price action analysis.

Why the Horizontal Grid Lines Chart Indicator Is Useful
Identifying support and resistance levels is a core part of successful forex trading. The Horizontal Grid Lines Chart Indicator for MT4 simplifies this task by automatically plotting horizontal lines at predefined intervals or price levels. This visual clarity allows traders to quickly assess where price may stall, reverse, or break through.
Because the indicator focuses on clarity rather than complex calculations, it is ideal for both beginner and advanced traders who prefer straightforward chart analysis.
How the Horizontal Grid Lines Chart Indicator Works
Once installed on the MT4 platform, the indicator places horizontal grid lines across the chart based on user-defined settings. Traders can customize how the grid appears to match their trading style and strategy.
Key configuration options include:
Fixed price intervals
Custom price levels Fibonacci-based grid placement Adjustable colors, line thickness, and styles
These features allow traders to tailor the grid to different markets, timeframes, and trading approaches.
Using the Indicator for Support and Resistance The Horizontal Grid Lines Chart Indicator for MT4 is especially effective for identifying potential entry and exit points. Traders often use the grid lines as reference zones where price may react.
Common trading applications include: trend
Buying near support levels identified by grid lines
Selling near resistance levels
Setting stop-loss and take-profit targets signal Confirming breakout or rejection areas By combining grid lines with candlestick patterns or other technical indicators, traders can significantly improve decision-making accuracy.
Benefits of the Horizontal Grid Lines Chart Indicator
Clear Visual Structure: Simplifies Price Action analysis
Support and Resistance Identification: Highlights key price zones
User-Friendly Design: Easy setup and customization
MT4 Compatibility: Works smoothly on all MT4 charts
Free to Use: Accessible to all forex traders
This indicator does not generate buy or sell signals on its own but serves as a powerful visual aid that enhances almost any trading strategy.
Improve your chart clarity and trading precision by using the Horizontal Grid Lines Chart Indicator for MT4. Visit IndicatorForest.com to download this helpful indicator and explore a wide range of professional forex tools designed to support smarter trading decisions.
3 Downloads
Published:
Jan 13, 2026 23:06 PM
Category: