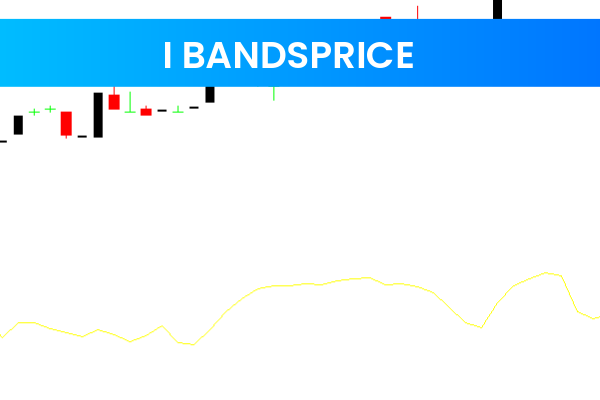
What Is the I-BandsPrice Indicator
The I-BandsPrice Indicator is a popular and reliable Forex trading tool designed for the MetaTrader 4 platform. It is especially useful for traders who want to identify price reversals, trend changes, and volatility conditions with greater clarity. This indicator is free to download and suitable for traders of all experience levels.
The I-BandsPrice Indicator combines moving averages with Bollinger Bands to analyze price behavior. By plotting dynamic upper and lower bands on the chart, it helps traders visually recognize when the market is overextended and when a potential reversal or breakout may occur.
How the I-BandsPrice Indicator Works
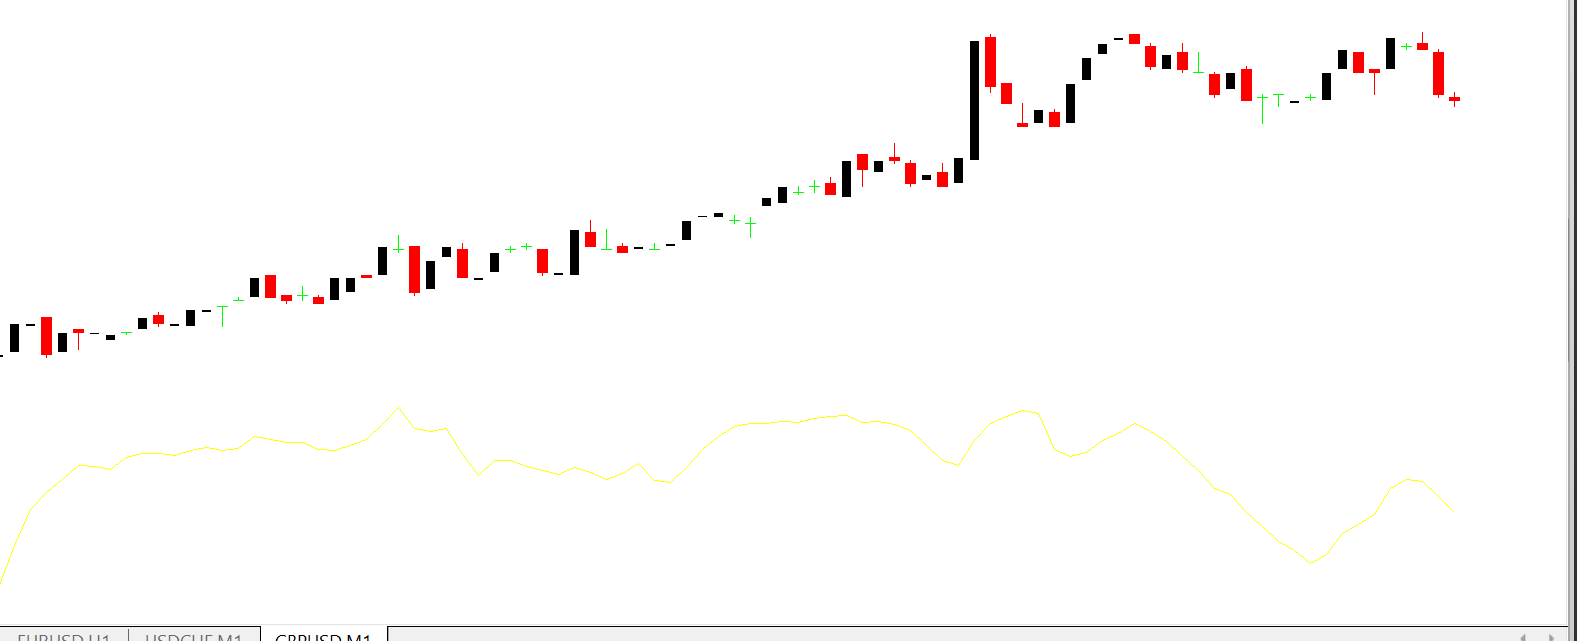
The I-BandsPrice Indicator calculates price volatility using Bollinger Band logic while incorporating moving averages for smoother price interpretation. The indicator plots:
Upper price band
Lower price band
A signal line based on a simple moving average
When price approaches or touches the upper band, it may indicate overbought conditions. When price nears the lower band, it may suggest oversold conditions. The signal line helps traders confirm whether price momentum is weakening or strengthening, offering early clues of potential direction changes.
This combination allows traders to analyze both price direction and volatility in one simple indicator.
Benefits of Using the I-BandsPrice Indicator
The I-BandsPrice Indicator provides several advantages that make it a valuable addition to any MT4 trading setup.
Clear Price Reversal Signals
By observing how price interacts with the upper and lower bands, traders can identify possible reversal zones with higher confidence.
Volatility-Based Market Insight
The widening and narrowing of the bands reflect changes in market volatility, helping traders prepare for breakouts or consolidation phases.
Easy-to-Read Chart Display
The indicator is visually clean and easy to understand, making it ideal for beginner traders while still being powerful enough for professionals.
Works on Any Timeframe
The I-BandsPrice Indicator can be applied to all timeframes, from short-term Scalping charts to long-term swing trading setups.
Trading Strategies Using the I-BandsPrice Indicator
The I-BandsPrice Indicator can be used on its own or combined with other technical tools to create effective trading strategies.
Reversal Trading Strategy
When price touches or exceeds the upper band and starts moving back toward the signal line, it may indicate a potential bearish reversal. Likewise, price bouncing from the lower band toward the signal line can signal a bullish reversal.
Breakout Trading Strategy
When the bands contract tightly and then suddenly expand, it often signals a volatility breakout. Traders can use this expansion as confirmation to enter breakout trades.
Trend Continuation Strategy
During strong trends, price may ride along one band. Traders can use the signal line to confirm trend continuation entries after pullbacks.
Support And Resistance Identification
The upper and lower bands often act as dynamic support and resistance levels, helping traders plan entries, exits, and stop-loss placements.
Best Practices for Using the I-BandsPrice Indicator
To maximize effectiveness:
Combine it with trend indicators such as moving averages or ADX
Use confirmation from candlestick patterns trend
Avoid trading against strong momentum without confirmation
Apply proper risk management on every trade
Testing the indicator on a demo account before live trading is strongly recommended.
Why Download from IndicatorForest.com
At IndicatorForest.com, traders can find high-quality, free, and carefully tested MT4 indicators like the I-BandsPrice Indicator. Each indicator is selected to help traders analyze markets more effectively and make smarter trading decisions.
👉 Visit IndicatorForest.com to download the I-BandsPrice Indicator and explore a wide range of professional Forex indicators designed to improve consistency and performance.
Published:
Dec 30, 2025 10:46 AM
Category: