Enhance Your Technical Analysis with the I CWR Indicators
In the competitive world of financial markets, having a clear view of price structure is essential for consistent profitability. The I CWR Indicators represent a powerful suite of technical tools designed to help traders identify trend exhaustion and structural shifts with high accuracy. Whether you are a day trader or a long-term investor, understanding market waves is the key to timing your entries and exits effectively.
What is the I CWR Indicator?
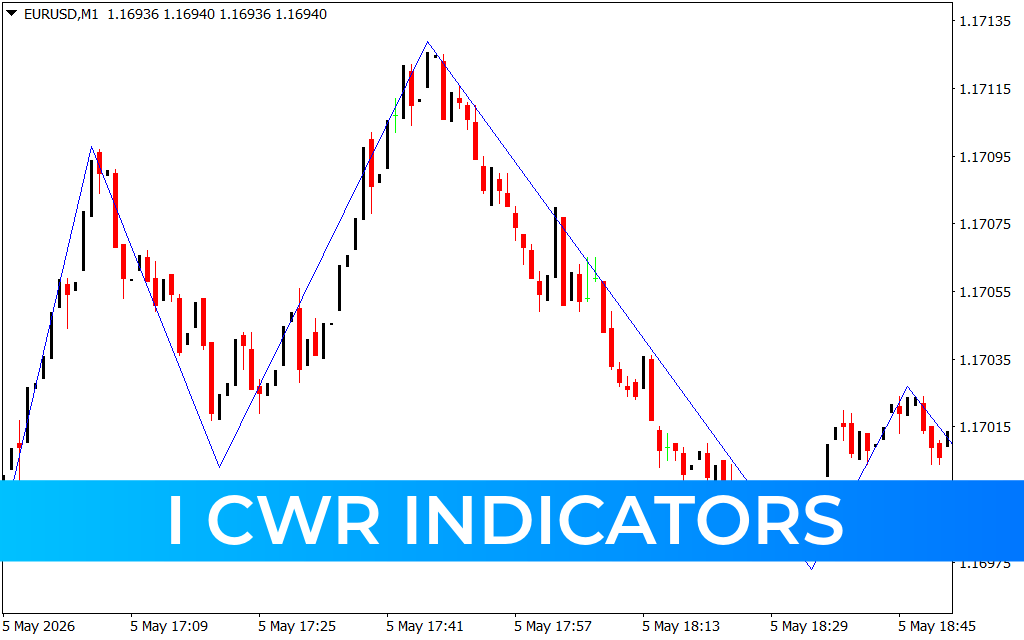
The I CWR Indicator is a trend-following and structural analysis tool that focuses on identifying wave patterns and cycle changes. By drawing dynamic lines that connect significant price peaks and troughs, the indicator provides a visual roadmap of market momentum. It effectively filters out the "market noise" that often leads to false signals, allowing traders to focus on high-probability setups.
Key Features and Benefits
Traders across various asset classes use the I CWR suite for its unique ability to simplify complex Price Action. Key benefits include:
- Precise Structural Mapping: The indicator automatically identifies major swing highs and lows, helping you visualize the market's current phase—whether it is trending, consolidating, or reversing.
- Trend Reversal Identification: By analyzing the slope and length of price waves, I CWR can signal when a trend is losing steam, providing early warnings of potential reversals.
- Clean Visual Interface: Designed for clarity, the indicator uses high-contrast lines that work perfectly on any chart background, ensuring you can see critical levels at a glance.
- Versatility Across Assets: While highly popular in the Forex market, the I CWR Indicators are equally effective for trading stocks, commodities, and cryptocurrencies.
Trading Strategy: How to Use I CWR Effectively
Success with the I CWR Indicators comes from understanding "Market Geometry." When the indicator plots a lower high followed by a lower low, it confirms a bearish structure shift. Conversely, a higher low followed by a higher high indicates bullish momentum.
To maximize your results, use I CWR in conjunction with price action patterns like Pin Bars or Engulfing candles at the "V" points created by the indicator lines. These points often act as dynamic support or resistance zones. By entering trades at these structural pivot points, you can achieve a significantly better risk-to-reward ratio.
Conclusion
The I CWR Indicators are an indispensable asset for any trader looking to master technical analysis. By providing a clear, objective view of Market Structure, this tool removes the emotional guesswork often associated with trading. If you want to refine your strategy and trade with the confidence of a professional, integrating the I CWR Indicators into your platform is a strategic move for long-term success.
1 Download
Last Update:
May 06, 2026 01:36 AM
Published:
Jan 27, 2026 13:17 PM
Category: