Mastering Market Structure with the I Intra Day Indicator
In the high-octane world of intraday Forex trading, success is often determined by a trader’s ability to define the boundaries of the current trading session. Prices fluctuate continuously, but professional traders know that the market tends to respect specific Support And Resistance zones established during the early hours of the day. The I Intra Day indicator is a sophisticated technical tool designed to automatically identify these critical zones, allowing traders to navigate the markets with precision and confidence.
Understanding the Intraday Framework
The core philosophy behind the I Intra Day indicator is the recognition that Price Action often moves within a range dictated by the session's highs and lows. Instead of manually drawing trendlines and horizontal supports every few hours, this indicator calculates and plots these essential levels in real-time.
By mapping the upper and lower boundaries of a session, the I Intra Day indicator transforms chaotic price movements into a structured environment. These boundaries serve as key "decision zones":
- The Upper Boundary: Often acts as a ceiling where selling pressure is expected to intensify. A breakthrough above this level can signal the start of a strong bullish impulse.
- The Lower Boundary: Represents a floor where buying interest typically stabilizes the price. A breach below this line can indicate a significant shift toward bearish momentum.
Why Intraday Traders Rely on Structural Levels
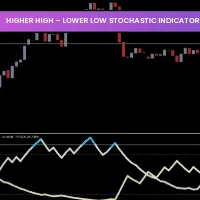
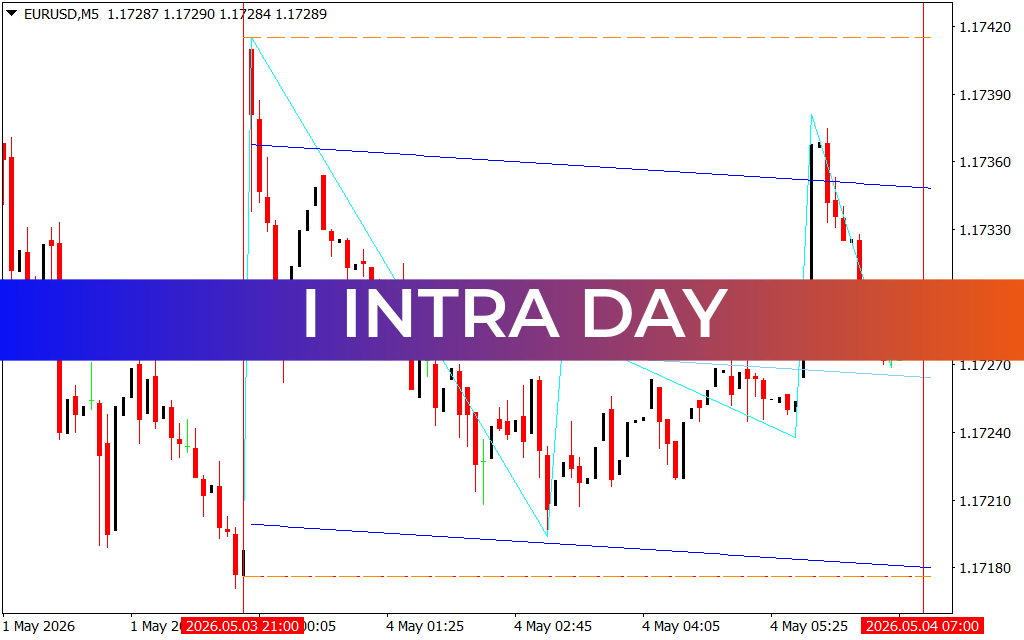
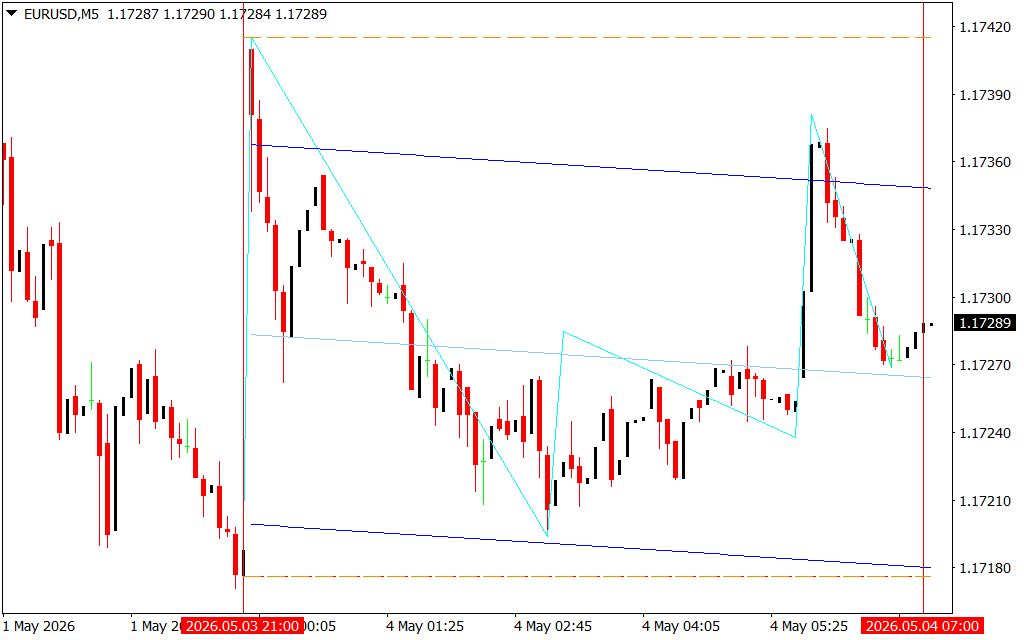
As illustrated in the EURUSD M5 chart, the I Intra Day indicator provides a clear visual representation of volatility and trend channels. For scalpers and day traders, these levels are invaluable for three primary reasons:
- Noise Reduction: By focusing on the structural boundaries, traders can ignore minor "micro-pullbacks" that often lead to premature exits.
- Objective Entry Points: Rather than guessing where to enter, traders can set limit orders near the lower boundary for long positions or look for reversal patterns near the upper boundary for shorts.
- Risk Management: Stop-loss placement becomes much more logical. By trading from one boundary toward the other, the risk-to-reward ratio is naturally optimized, as the opposite side of the channel provides an objective profit target.
Enhancing Your Trading Strategy
The I Intra Day indicator is highly versatile. It works seamlessly on lower timeframes like the M5, where speed and precision are paramount. By combining these structural zones with momentum indicators, you can filter out false breakouts and only engage with the market when the price reacts to these high-probability areas. Whether the market is ranging or trending, having the I Intra Day framework on your screen ensures that you are constantly aware of the macro-structural landscape, regardless of how much the price fluctuates on a minute-by-minute basis. It is the ultimate tool for maintaining discipline in a demanding market environment.
6 Downloads
Last Update:
May 04, 2026 10:07 AM
Published:
Jan 28, 2026 17:50 PM
Category: