Master the Daily Flow with the I Intraday Fibonacci Indicator
In the high-velocity environment of day trading, having a reliable map of price potential is the difference between a successful session and a series of missed opportunities. While many traders attempt to draw manual Fibonacci levels, the process is often prone to human error and subjectivity. The I Intraday Fibonacci indicator for MetaTrader 4 (MT4) is a professional-grade technical tool that automates the plotting of daily retracement and expansion levels, providing a structured mathematical framework for every trading session.
The Power of Intraday Fibonacci Levels
Fibonacci levels are based on the "Golden Ratio," a mathematical sequence that institutional algorithms and bank traders use to identify hidden Support And Resistance. The I Intraday Fibonacci indicator specifically focuses on the daily range, anchoring its levels to the current session's high and low. This ensures that the levels you are trading are fresh, relevant, and respected by the market's biggest participants.
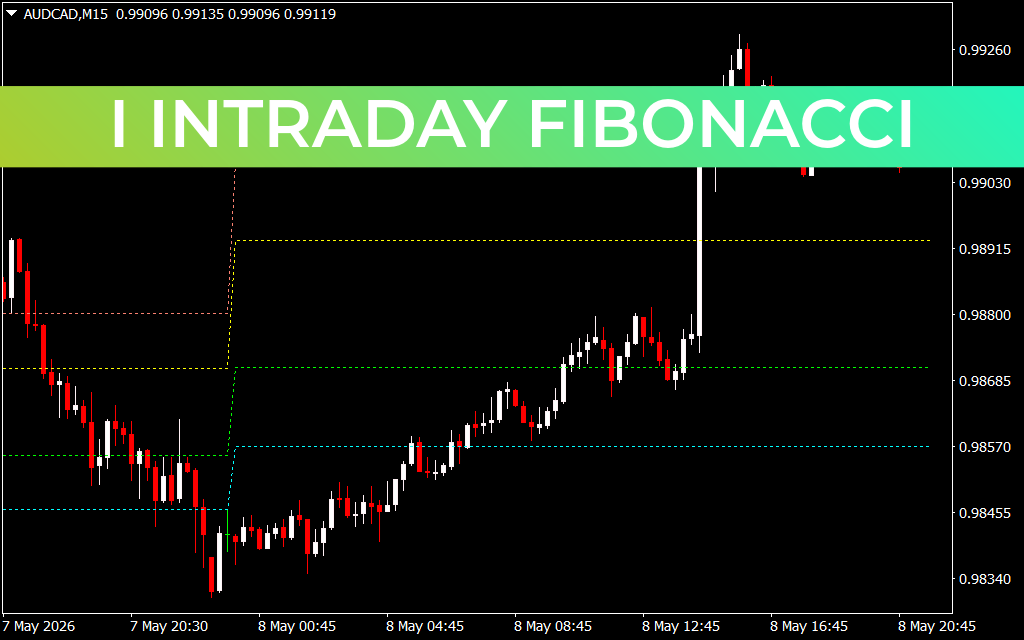
As demonstrated on the AUD/CAD M15 chart, the indicator plots a series of horizontal levels—typically including the 0.0, 23.6, 38.2, 50.0, 61.8, and 100.0 ratios. These act as "geographic" markers for price, showing exactly where a retracement is likely to find support or where a breakout is likely to encounter resistance.
Key Features and Strategic Advantages
- Fully Automated Daily Plotting: The indicator removes the tedious work of manual drawing. As soon as a new trading day begins and the price establishes an initial range, the Fibonacci grid scales automatically to provide an updated roadmap.
- Precision Entry and Exit Zones: By using the 38.2% and 61.8% levels, traders can identify high-probability "deep retracement" entries. These levels represent the "sweet spot" where institutional money often steps back into a trend.
- Visual Structure for Scalpers: On lower timeframes like the M15, the indicator defines the intraday "playing field." It helps traders avoid the "no-man's land" in the middle of a range and focus on high-conviction trades at the boundaries.
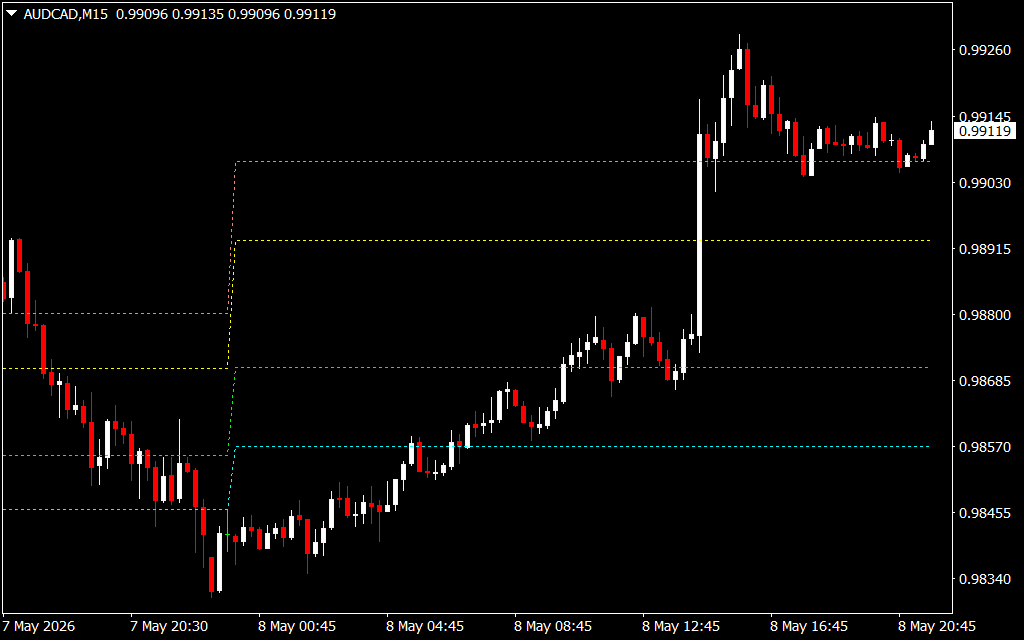
- Dynamic Support and Resistance: Unlike fixed pivot points, these Fibonacci levels adapt to the day's volatility. If the price breaks the 100% level, the indicator highlights expansion targets, helping you ride a trend to its maximum potential.
- Seamless Chart Integration: Designed for professional clarity, the indicator uses clean, non-obtrusive lines that allow you to layer other tools, such as the CCI Histogram or Moving Averages, for ultimate confluence.
Strategic Execution
The most effective way to utilize the I Intraday Fibonacci is through the "50% Bounce" strategy. In a trending market, price will often return to the 50% or 61.8% median level of the daily range. When price touches these levels and shows a rejection candle (like a pin bar or engulfing pattern), it provides an objective signal to enter in the direction of the dominant trend.
For breakout traders, the 100% level acts as the ultimate filter. A decisive close above the daily 100% Fibonacci level suggests that the market has entered an expansion phase, opening the door for aggressive long positions toward the next historical target.
Conclusion
Success in intraday trading requires a balance of speed and precision. The I Intraday Fibonacci indicator provides that balance by automating one of the most powerful technical concepts in finance. By grounding your strategy in the mathematical certainty of the Golden Ratio, you can trade with the confidence of an institutional professional. Elevate your MT4 platform and start mastering the daily flow by adding this essential tool to your technical arsenal today.
4 Downloads
Last Update:
May 10, 2026 01:52 AM
Published:
Jan 24, 2026 16:34 PM
Category: