Master Dynamic Resistance with the I-MA Fibs Above Indicator
In the complex ecosystem of Forex trading, understanding where the price is likely to stall or reverse is the difference between a winning trade and a stopped-out position. The I-MA Fibs Above Indicator is a sophisticated technical overlay for MetaTrader 4 that bridges the gap between trend-following moving averages and predictive Fibonacci levels. By projecting dynamic Fibonacci expansion zones above a core moving average, this indicator provides traders with a real-time map of potential overhead resistance.
The Logic of Moving Average Envelopes
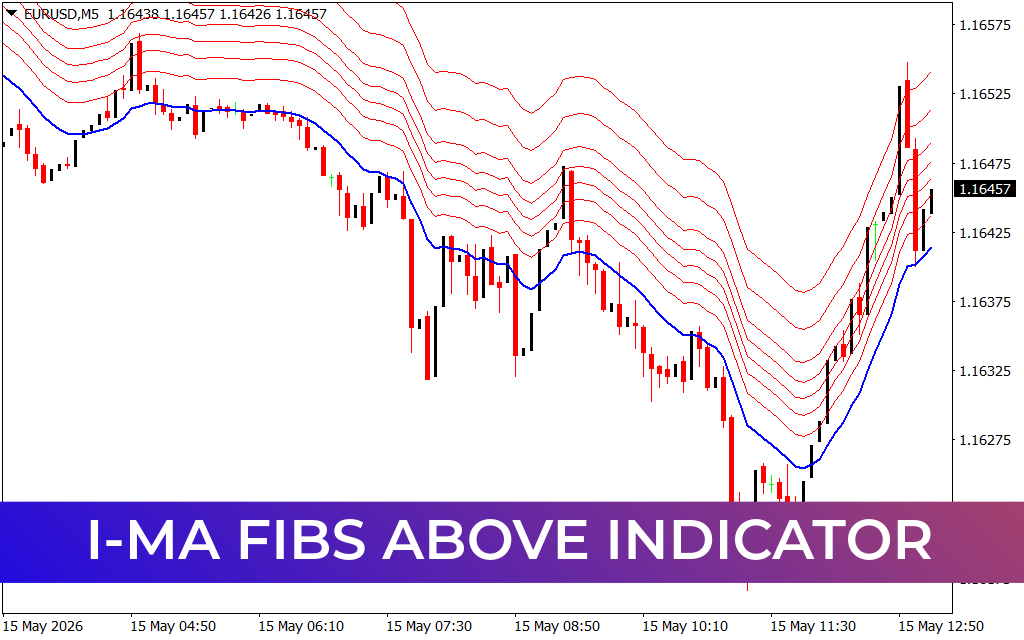
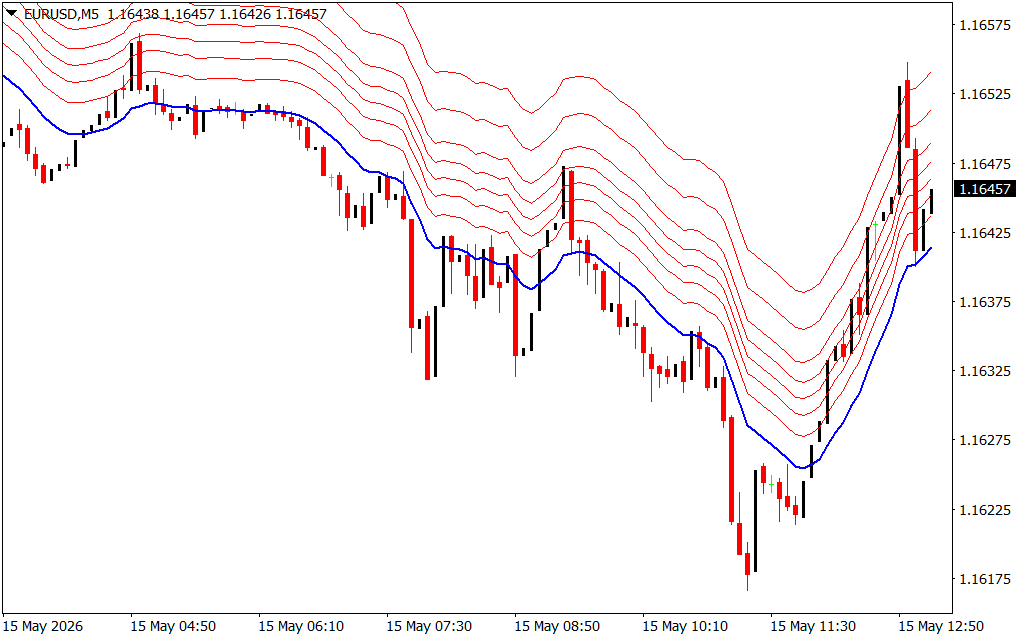
The I-MA Fibs Above Indicator is built on a foundation of a smoothed Moving Average (MA), often represented by a bold blue line. However, unlike standard moving averages that only track past Price Action, this tool uses Fibonacci ratios (such as 23.6%, 38.2%, 61.8%, and 100%) to plot a series of red envelopes above the price.
These red lines act as dynamic mathematical "ceilings." In a trending market, price rarely moves in a straight line; it breathes. The I-MA Fibs Above helps you visualize the outer limits of these breaths, identifying exactly where a bullish move is becoming statistically overextended.
Identifying High-Probability Reversal Zones
As seen in the EURUSD M5 chart, the indicator excels at highlighting "exhaustion spikes." When price action aggressively pierces the upper red Fibonacci bands, it indicates that the asset is entering an overbought state relative to its mean.
- Scalping Opportunities: For short-term traders, a touch of the outermost red bands followed by a bearish candlestick pattern (like a shooting star or engulfing candle) provides a high-confluence signal to enter a counter-trend scalp.
- Trend Following: If the price is trending downwards and pullbacks consistently fail at the lower red Fibonacci levels, it confirms that the bearish momentum is strong and the "ceiling" is holding.
- Target Setting: For those already in a long position, these Fibonacci lines serve as objective Take Profit levels. Instead of guessing where the trend might end, you can exit your position as the price hits a major Fibonacci expansion band.
Strategic Advantages for the Modern Trader
The primary benefit of the I-MA Fibs Above Indicator is its ability to adapt to current market volatility. Unlike static pivot points that remain fixed throughout the day, these bands expand and contract based on the slope of the moving average and the velocity of price movement.
- Objective Resistance: It removes the subjectivity of drawing manual Fibonacci fans or retracements, ensuring you are trading based on consistent mathematical rules.
- Visual Clarity: The clean distinction between the blue base trend line and the red resistance zones allows for instant market assessment without over-complicating your chart.
- Versatility: While highly effective on the M5 and M15 timeframes for intraday trading, it is a robust tool for swing traders looking for cycle peaks on the H4 or Daily charts.
By integrating the I-MA Fibs Above Indicator into your trading arsenal, you gain a predictive edge that identifies not just where the market has been, but where it is likely to face its next major hurdle.
2 Downloads
Last Update:
May 15, 2026 16:13 PM
Published:
Jan 21, 2026 20:17 PM
Category: