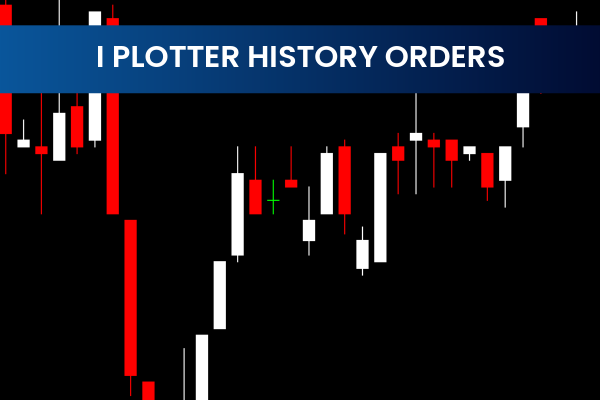
The I Plotter History Orders Indicator is a free and popular Forex Indicator designed for the MetaTrader 4 (MT4) platform. It provides traders with a simple and efficient way to review their past trades and analyze overall trading performance. By visualizing entries, exits, and profits or losses directly on the chart, this indicator makes it easier to identify patterns, strengths, and weaknesses in trading strategies.
Whether you are a beginner looking to understand your trading decisions or an experienced trader aiming to optimize performance, the I Plotter History Orders Indicator is an invaluable tool. It offers a clear, visual overview of your trading history, allowing for better decision-making and improved risk management.
What Is the I Plotter History Orders Indicator?
The I Plotter History Orders Indicator is a chart-based tool that shows:
Entry points of past trades
Exit points of past trades
Profit or loss for each trade
Overall account performance
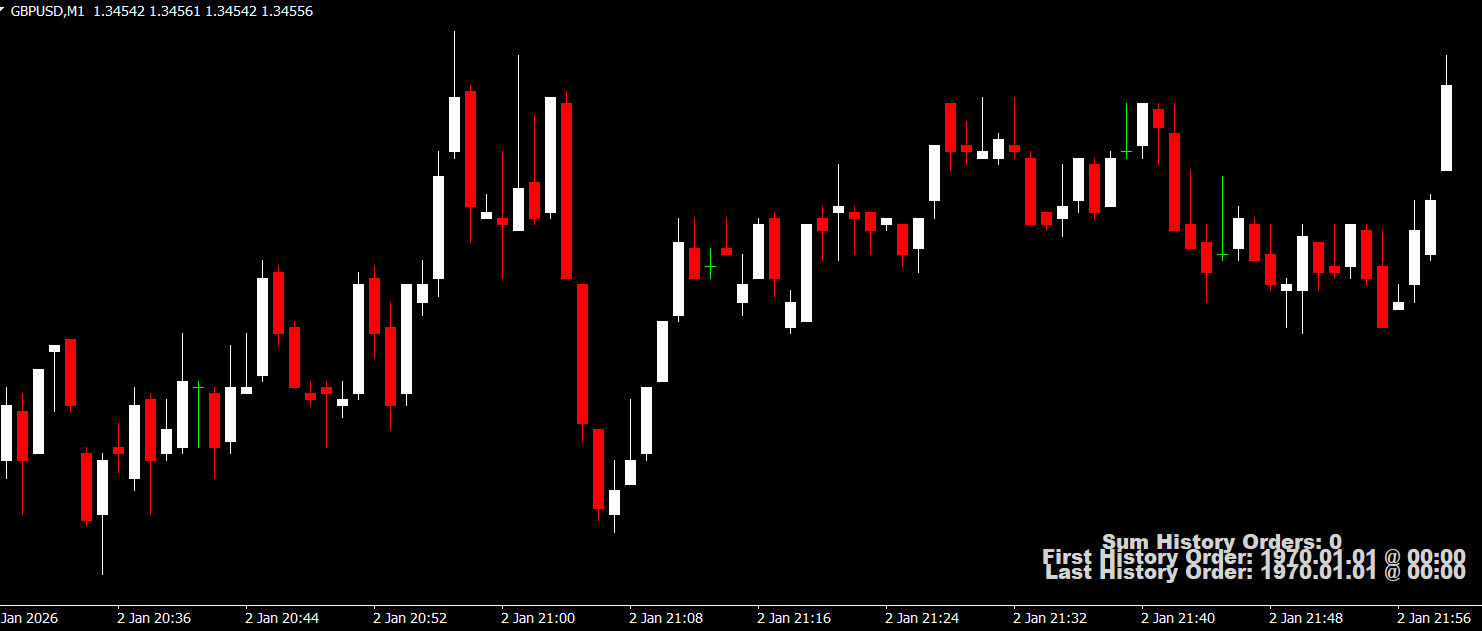
Unlike traditional account statements, this indicator visualizes trades directly on the MT4 chart, making it easier to analyze trading decisions in the context of price movements.
Key Features of the Indicator
The indicator comes with several useful features for Forex traders:
Automatically displays past orders on the chart
Shows entry, exit, and profit/loss for each trade
Visualizes overall account performance trend
Customizable display settings (color, thickness, line size)
Works on all MT4 timeframes and currency pairs
Free to download and easy to install signal
Customizing the display allows traders to quickly differentiate profitable trades from losing trades and recognize recurring patterns.
Benefits of Using the I Plotter History Orders Indicator
Quick Performance Review
Traders can instantly see how past trades performed without needing to check separate reports or spreadsheets.
Trade Pattern Analysis
By plotting trades on the chart, traders can identify patterns in market behavior and their own trading strategies, helping to refine decision-making.
Improved Risk Management
Seeing both winning and losing trades visually helps traders evaluate risk exposure and make informed adjustments to stop-loss or take-profit levels.
User-Friendly Customization
Adjustable settings for colors, line thickness, and size make it easier to match the indicator to personal preferences and improve clarity.
How to Use the Indicator
Install the indicator on the MT4 platform.
Attach it to any chart to automatically display your level historical trades.
Customize display settings to distinguish between winning and losing trades.
Analyze trading patterns, trends, and account performance to improve future decisions.
Traders often use this indicator in combination with other performance analysis tools for a more comprehensive review of their strategies.
Why Traders Trust the I Plotter History Orders Indicator
Traders appreciate this indicator for its simplicity and effectiveness. It eliminates the need for manual record-keeping and instantly provides insights into trading habits. By visualizing past trades, traders can make data-driven improvements to their strategies and enhance overall performance.
For anyone serious about tracking performance and improving trading efficiency, the I Plotter History Orders Indicator is an essential MT4 tool.
Call to Action
To download the I Plotter History Orders Indicator and explore more free MT4 Forex tools, visit IndicatorForest.com and start analyzing your trades with professional-grade indicators today.
Published:
Jan 05, 2026 01:24 AM
Category: