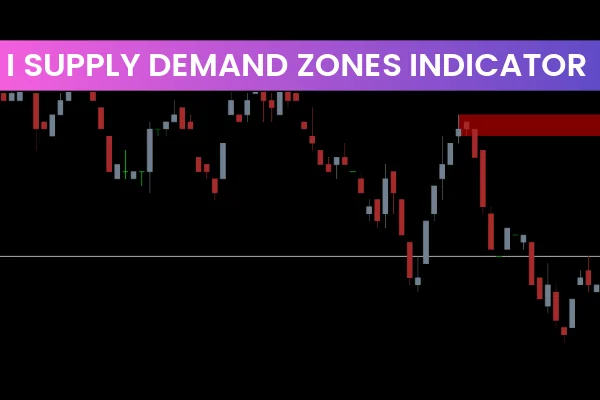
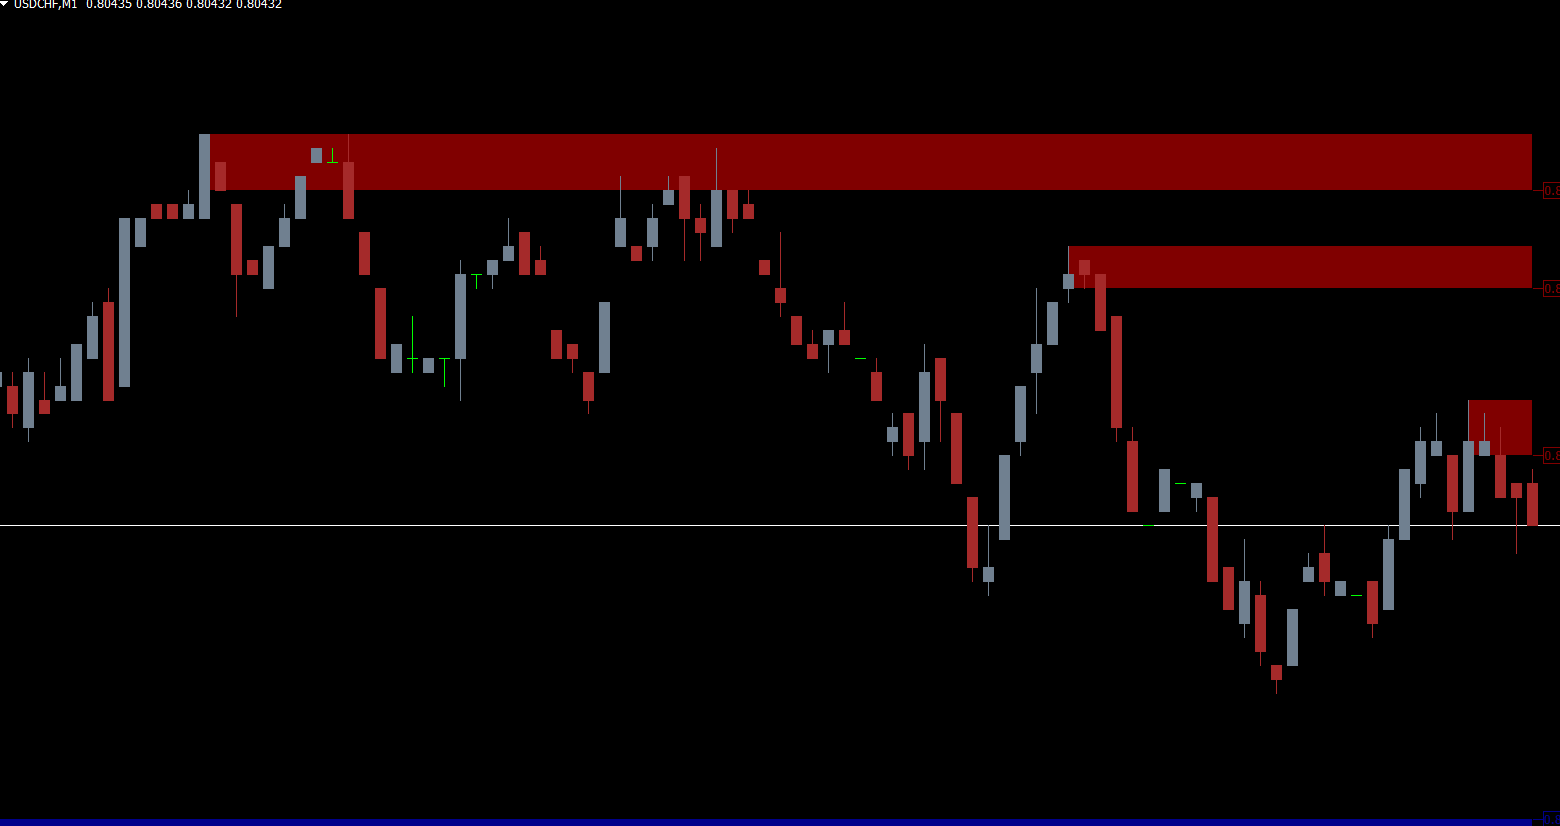
The I Supply Demand Zones Indicator for MT4 is an essential tool for forex traders looking to identify key market zones for profitable trades. By automatically plotting Supply And Demand areas on the MT4 chart, the indicator saves time and eliminates guesswork. Properly identifying these zones allows traders to anticipate price reversals, enter trades with higher confidence, and improve overall profitability.
Supply and demand zones are similar to traditional Support And Resistance levels but offer wider areas of market interest, making them more effective for identifying potential entry and exit points. Unlike single-line support/resistance, zones account for the fact that most traders act within a price range, not at a single level.
Understanding Supply and Demand Zones
Supply and demand zones are key price areas where the market has historically shown strong buying (demand) or selling (supply) pressure:
Demand Zones: Areas where buyers are likely to step in, pushing prices higher
Supply Zones: Areas where sellers are likely to act, causing prices to drop
These zones help traders predict where the market may reverse or stall, providing high-probability trade setups.
How to Trade Using I Supply Demand Zones Indicator for MT4
The I Supply Demand Zones Indicator for MT4 automatically identifies the best zones and draws them directly on your chart. This feature allows traders to:
Buy at Demand Zones: Enter long positions anticipating upward movement
Sell at Supply Zones: Open short positions expecting bearish reversals
Most traders place stop-loss orders just below demand zones or above supply zones to manage risk. Swing traders often hold positions until the price reaches the opposite zone, while intraday traders may adjust entries based on risk/reward calculations.
Importance of Higher Timeframe Supply and Demand Zones
Higher timeframe zones, such as H1 or H4, are more reliable and provide stronger trend confirmation. Using higher timeframe analysis, traders can:
Stay aligned with the overall market trend
Identify stronger and more reliable zones
Reduce false signals that occur in lower timeframes
For example, in a GBPUSD M15 chart, smaller zones may appear frequently, while H1 zones represent broader market sentiment. By combining multiple timeframes, traders can execute trades with higher accuracy and confidence.
Advantages of the I Supply Demand Zones Indicator
Automatic Zone Detection
The indicator identifies key supply and demand areas without manual plotting.
Supports Multiple Trading Strategies
Ideal for swing trading, day trading, and Price Action strategies.
Time-Saving and Efficient
Traders can focus on executing trades rather than identifying zones manually.
Beginner and Advanced Friendly
Useful for new traders to learn zone-based trading, and for advanced traders to integrate into complex strategies.
Limitations to Consider
While the I Supply Demand Zones Indicator for MT4 automates zone plotting, traders must validate zones manually. Markets can breach zones, and price may not always react as expected. Combining the indicator with price action confirmation improves trade reliability.
Conclusion
The I Supply Demand Zones Indicator for MT4 is a powerful tool for identifying key supply and demand areas automatically. By providing a clear visualization of zones on multiple timeframes, it helps traders anticipate price movements, enter high-probability trades, and manage risk effectively.
For more free and premium MT4 indicators to enhance your trading, visit IndicatorForest.com today.
FAQ
4 Downloads
Published:
Dec 01, 2025 22:38 PM
Category: