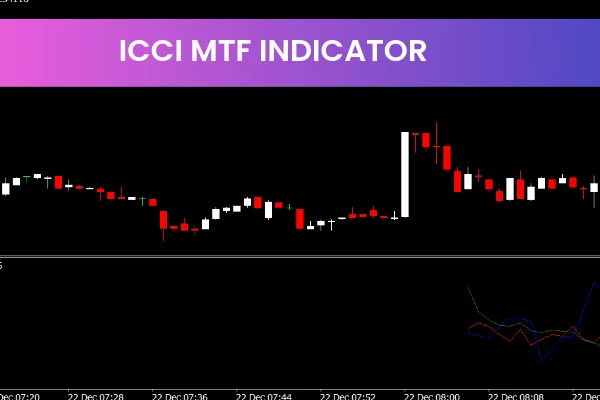
The ICCI MTF Indicator is a useful and popular free Forex indicator designed for the MetaTrader 4 trading platform. It is widely used by traders who want to identify trend direction, measure Trend Strength, and locate reliable entry and exit points in the Forex market. Thanks to its clear channel-based structure and multi timeframe capability, the ICCI MTF Indicator is suitable for traders of all experience levels.
This indicator is especially helpful for traders who prefer trend-following strategies and want to align their trades with higher timeframe market direction. Its simple visual presentation makes it easy to interpret market conditions without overcrowding the chart.
Understanding How the ICCI MTF Indicator Works
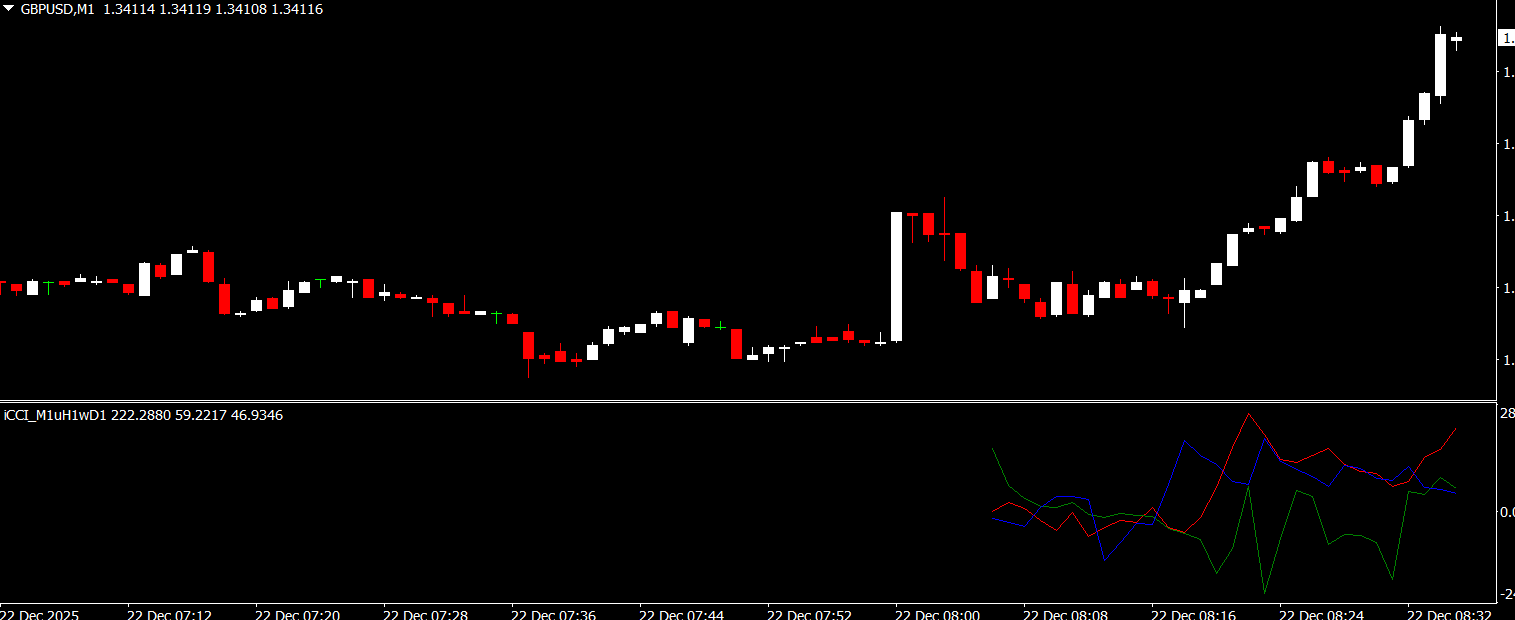
The ICCI MTF Indicator consists of two lines that move together to form a channel. The upper line acts as the signal line, while the lower line functions as a support line. Together, these lines help traders visualize price movement within a structured trend framework.
When the signal line is positioned above the support line, it indicates that bullish momentum is dominating the market. When the signal line moves below the support line, it suggests bearish momentum and selling pressure. The distance between the two lines can also provide insight into trend strength, with wider separation often signaling stronger trends.
Because this is a multi timeframe indicator, it can display trend information from higher timeframes while trading on a lower timeframe chart. This helps traders avoid countertrend trades and improves overall signal reliability.
Key Features and Benefits
Identifies bullish and bearish trend direction
Displays trend strength using channel structure
Uses signal and support lines for clarity
Multi timeframe analysis for better confirmation
Helps locate potential entry and exit points
Reduces false signals in ranging markets
Suitable for trend-following strategies
Works on all currency pairs
Compatible with all MT4 timeframes
Free to download and use on MT4
Using the ICCI MTF Indicator in Trading
To use the ICCI MTF Indicator, traders simply attach it to any MT4 chart and select their preferred timeframe settings. Once applied, the indicator automatically calculates trend conditions and updates in real time.
A common trading approach is to look for buy opportunities when the signal line crosses above the support line from below. This crossover often indicates a shift toward bullish momentum. Sell opportunities may be considered when the signal line crosses below the support line, signaling a potential bearish move.
Traders often use the ICCI MTF Indicator in combination with Support And Resistance levels, candlestick patterns, or momentum indicators to confirm signals. Aligning lower timeframe entries with higher timeframe trends can significantly improve trade accuracy and consistency.
The indicator can be used for Scalping, day trading, or swing trading, depending on the selected timeframe configuration.
Why Traders Choose the ICCI MTF Indicator
Traders choose the ICCI MTF Indicator because it delivers clear and structured trend analysis without unnecessary complexity. Its channel-based design helps traders stay disciplined and focused on trend direction rather than short-term market noise.
The multi timeframe feature is especially valuable, allowing traders to see the bigger market picture while executing precise entries. Being free, reliable, and easy to use makes the ICCI MTF Indicator a popular choice among MT4 Forex traders.
To download the ICCI MTF Indicator and explore more professional Forex tools, visit IndicatorForest.com and strengthen your trading strategy t
FAQ
Published:
Dec 22, 2025 02:38 AM
Category: